Equity
.html
Equity
This module includes the following topics:
- Refinitiv Eikon Quick Start (02:50)
- About the Refinitiv Eikon Toolbar (01:59)
- Explore the Refinitiv Eikon Menu (02:22)
- Using the Search Box to Find Tools and Data (03:51)
- Managing your Workspace (03:13)
- Linking Apps (01:00)
- Getting Help and Support (02:20)
Hosted on Refinitiv Messenger, the forums allow you to chat, post questions, debate and exchange ideas directly with Refinitiv journalists, industry contacts and peers at leading global companies.
The MBS Aggregations App delivers complete agency mortgage issuance data sourced from loan level disclosures.
The StarMine Equity Risk Premium Model estimates the long-term equity market excess return above a risk-free rate for major equity markets across the globe. Discover our new app which exposes the final and intermediate results, and allows you to analyze scenarios by overriding inputs.
In this video discover how Watchlist Pulse (PULSE) brings together Refinitiv proprietary content and analytics to make it easier for you to identify what will have an impact on your coverage list today.
This module includes the following topics:
- Create a Chart App (02:18)
- Customizing a Chart App Quickly (03:03)
- Add Analyses and Trendlines to a Chart (03:04)
- Adding a Chart to your Favorites (01:27)
- Linking a Quote List with a Chart App (01:38)
- Use Relative Performance Analysis (02:13)
- Sharing Apps using Messenger (01:58)
- Export Chart Data to Excel (01:33)
- Customizing Chart Properties (03:34)
This module includes the following topics:
- An overview of Chart Views in Refinitiv Eikon (1:00)
- The Company Chart View (2:15)
- Comparing Companies (2:00)
- Charting Fundamental Data with Chart Builder (2:00)
- Using Chart Builder to Create an Analysis Chart (3:00)
- Using Workflow Charts (4:11)
- Accessing Charts from the App Library (1:30)
- Using Refinitiv Eikon Answers to Create a Technical Analysis Chart (2:30)
Power Tip: Learn how to graphically view historical economic data.
This modules includes the following topics:
- Introduction (00:37)
- Loading Lists in Monitor (01:34)
- Column Formatting (01:11)
- Classification of Portfolios and Lists (01:09)
- Preferences (00:57)
- Adding Template Fields (00:59)
- Universal Data Item Picker (UDIP) (00:50)
- Sorting (00:40)
- Column and Row Right Click Menus (00:40)
- Column Wrapping (1:00)
- Unlink Constituents (00:36)
- Conditional Coloring (1:33)
- Creating Formulas (00:43)
- Formulas - Referencing Another Column (00:57)
Keep up-to-date with Economic events in real-time, historically and looking forward. Learn how to add events to your calendar, for future reference. Total Running Time 3:27
This module includes the following topics:
- Introduction to Screener
- Using simple filters to create a screen
- Applying Advanced Filters to a screen
- Working with the Scatter Chart view
- Using Ownership Data in the Screener
- Screener Quick Tips
- Importing and Exporting
- Working with templates
The Signal App (SIGNAL) allows you to monitor in real-time a universe of securities against a set of technical criteria, and be alerted when any of the conditions are met. Select from a list of over 150 predefined signals or create your own using the Custom Signal Editor. Watch this short video to find out how.
The Technical Analysis Chart App allows you to apply various analyses to the instruments you monitor with intuitive collaboration tools. Discover how to access and use this powerful charting application.
Available in Refinitiv Eikon - Version 3.3 and later, the Relative Rotation Graph provides a visual presentation of how a group of securities (or sectors) are performing relative to a benchmark. If you are a trader or investment analyst then make the RRG a key piece in your investment research puzzle.
Do you want a top-down view of the market and to be able to easily analyze and identify stocks that fulfill your Investment requirements?
Learn how to perform total return calculations and analyze P&L for multiple instruments with the new Total Return app (short code TRTR), by taking full control of calculation settings. Also discover what the MS Office add-in has to offer.
The Option Watch App displays options contracts on a specified underlying asset. That being an equity, index, or a futures contract. Create filters to easily customize the list of options displayed on a variety of Exchange Traded Instruments, where they have associated Exchange Traded Options available. Watch this video to learn how to view your required options, customize and filter your Option search, and link to other Refinitiv Eikon Apps such as the Option Pricer or Financial Charts
This module includes the following topics:
- Option Pricer: An Introduction (01:39)
- Access the Option Pricer App (01:59)
- Master the Option Pricer Interface (03:11)
- Analyze a Delta Hedge using Option Pricer (01:58)
- Analyze a Strangle Strategy using Option Pricer (01:12)
- Analyze a Vertical Spread on Futures using Option Pricer (01:46)
Use the new Volatility Surface app to explore IVs for over 4,000 stocks, indices, and ETFs. Select from various settings for contract filtering and axis configuration to get the most from our rich market data and the SVI model.
Use the company Peers view (PEERS) to look at major competitors across Sector, Index or define your own lists. View Peer comparison tables and key metrics to assist in idea generation and fundamental analysis.
The through train between Shanghai and Hong Kong has arrived! Mainland investors can invest in Hong Kong ‘H’ shares, and the rest of the world can invest in Shanghai ‘A’ shares. In this short video, discover how to get the information you require in Refinitiv Eikon using theShanghai-Hong Kong Stock Connect app.
The Buy-Side Optimized Workflow dashboard is designed for buy-side traders. For the selected stock, it shows you what you’ve traded, who with, and how this lined up with the market. Along with analyst, IOI, and TradeAd based broker ranking views, it brings together the information you need to decide how to execute the next trade.
Find the liquidity you need to execute block trades off-exchange with Autex in Refinitiv Eikon. Autex is one of the leading networks for distributing IOIs and Trade Ads, with near saturation on the sell-side in the US. As a buy-side trader you can now monitor and analyze IOIs and Trade Ads without leaving the product. Watch this eLearning to discover how.
The Market Share Reporter app enables you to evaluate liquidity and market share movement across competing venues for shares traded in single instruments, indices, or all shares on those venues.
The Blended Order Book combines data on buying & selling interests from multiple exchanges, market makers and trade reporting venues. Watch this short video for a quick overview of the controls for adapting the app for your markets and preferences.
The Time And Sales app allows you to analyze exchange trading information both in real-time and historically. View trade logs and calculate VWAP for a single instrument, or activate Blended Mode to aggregate across venues. Discover some of the key customization settings in this short video.
Use the Autex BlockDATA app in Refinitiv Eikon to access the market leading database of historical Trade Advertisement messages. Create brokerage league tables for a stock, a portfolio of stocks, or aggregate by industry, sector, geographical location, and market cap. Schedule reports. Generate business. Discover Liquidity.
Use the Autex BlockDATA app in Refinitiv Eikon to access the market leading database of historical Trade Advertisement messages. Create brokerage league tables for a stock, a portfolio of stocks, or aggregate by industry, sector, geographical location, and market cap. Schedule reports. Generate business. Discover Liquidity.
Astec Short Interest features proprietary market data from the global securities lending industry, the prerequisite for shorting. Discover how the short side of the market is viewing securities, and apply this insight to diverse tasks such idea and strategy generation, risk management, and trade execution. Watch this video to find out how.
Refinitiv Ownership & Institutional Profiles content allows you to track the investment activity of key institutional investors and contact their key decision makers. Insider activity is also covered. Discover some of the key ways which this market leading content set is exposed in Refinitiv Eikon and its add-in for Microsoft Office.
Breakingviews is the world's leading source of agenda-setting financial insight. Use Refinitiv Eikon to expose this powerful content set, get a fresh angle on the latest stories, and generate new ideas.
This module includes the following topics:
- Option Pricer: An Introduction (01:39)
- Access the Option Pricer App (01:59)
- Master the Option Pricer Interface (03:11)
- Analyze a Delta Hedge using Option Pricer (01:58)
- Analyze a Strangle Strategy using Option Pricer (01:12)
- Analyze a Vertical Spread on Futures using Option Pricer (01:46)
The Option Watch App displays options contracts on a specified underlying asset. That being an equity, index, or a futures contract. Create filters to easily customize the list of options displayed on a variety of Exchange Traded Instruments, where they have associated Exchange Traded Options available. Watch this video to learn how to view your required options, customize and filter your Option search, and link to other Refinitiv Eikon Apps such as the Option Pricer or Financial Charts
Use the new Volatility Surface app to explore IVs for over 4,000 stocks, indices, and ETFs. Select from various settings for contract filtering and axis configuration to get the most from our rich market data and the SVI model.
The Signal App (SIGNAL) allows you to monitor in real-time a universe of securities against a set of technical criteria, and be alerted when any of the conditions are met. Select from a list of over 150 predefined signals or create your own using the Custom Signal Editor. Watch this short video to find out how.
Available in Refinitiv Eikon - Version 3.3 and later, the Relative Rotation Graph provides a visual presentation of how a group of securities (or sectors) are performing relative to a benchmark. If you are a trader or investment analyst then make the RRG a key piece in your investment research puzzle.
This is a longer course designed for those seeking to become an advanced user of Refinitiv Eikon - Microsoft Office. Cloud Functions allow you to process market data on the Data Cloud, thereby returning only the required end-results into Excel. This in turn allows you to create elegant and efficient workbooks with no need for large tables of underlying data nor complex systems of volatile Excel formulas. Despite operating exclusively on Price and Volume data items, the diversity of Technical Indicators makes them an ideal means to demonstrate a reasonable subset of the range of Cloud Functions, and associated techniques. (Level: Master Class)
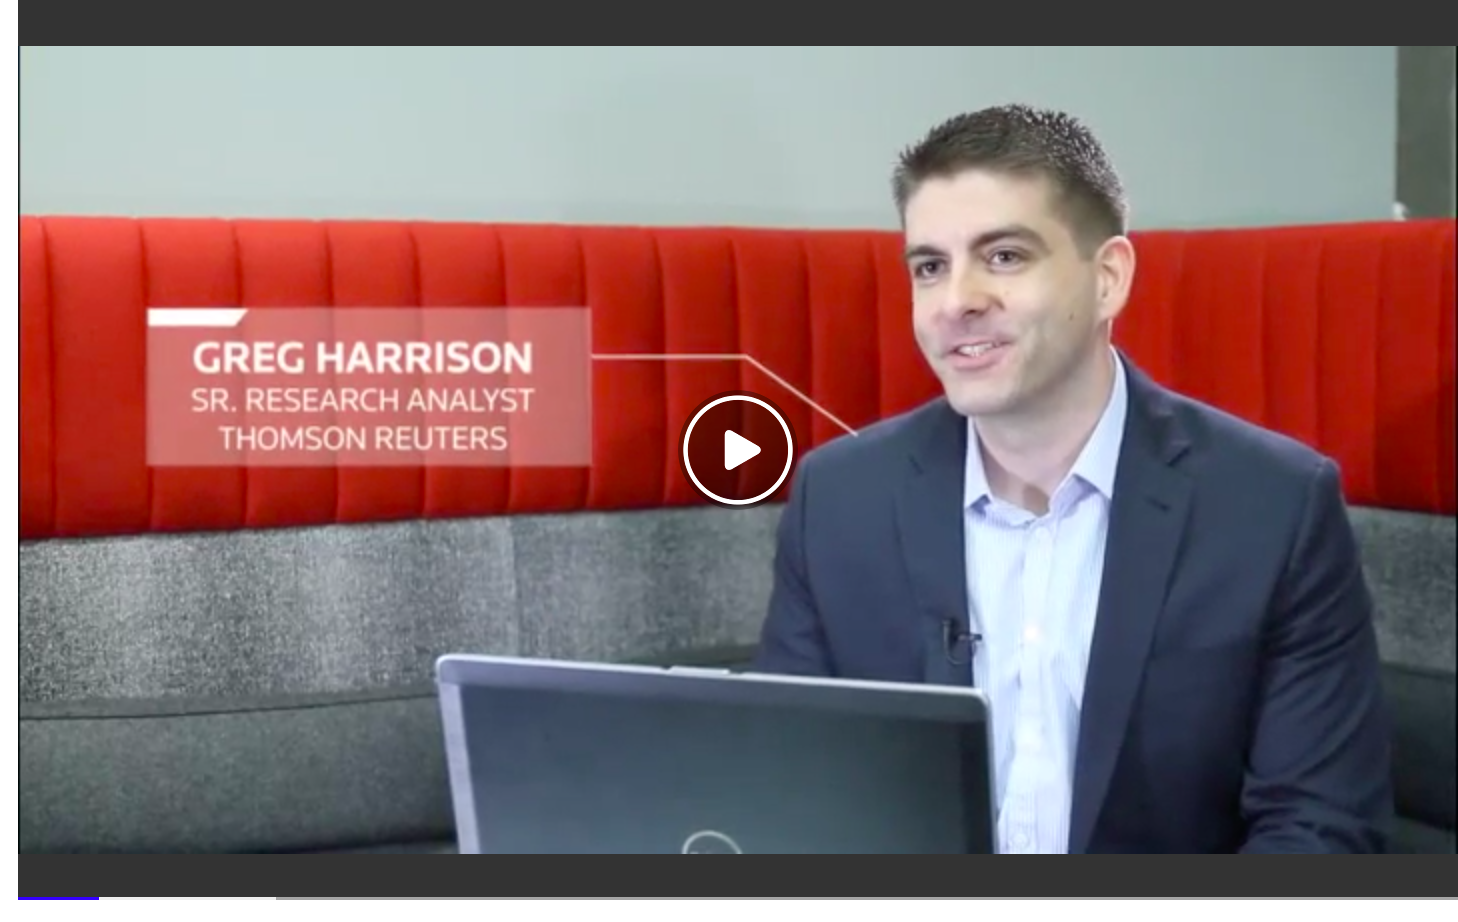
Meet Greg Harrison, Senior Research Analyst at Refinitiv. Find out how he uses Refinitiv Eikon to view earnings estimates, plot growth trends, and analyze historical earnings surprises. Discover the SmartEstimate which weights analyst predictions based on past performance.
The Signal App (SIGNAL) allows you to monitor in real-time a universe of securities against a set of technical criteria, and be alerted when any of the conditions are met. Select from a list of over 150 predefined signals or create your own using the Custom Signal Editor. Watch this short video to find out how.
Available in Refinitiv Eikon - Version 3.3 and later, the Relative Rotation Graph provides a visual presentation of how a group of securities (or sectors) are performing relative to a benchmark. If you are a trader or investment analyst then make the RRG a key piece in your investment research puzzle.
This module includes the following topics:
- Introduction to Screener
- Using simple filters to create a screen
- Applying Advanced Filters to a screen
- Working with the Scatter Chart view
- Using Ownership Data in the Screener
- Screener Quick Tips
- Importing and Exporting
- Working with templates
Meet Greg Harrison, Senior Research Analyst at Refinitiv. Find out how he uses Refinitiv Eikon to view earnings estimates, plot growth trends, and analyze historical earnings surprises. Discover the SmartEstimate which weights analyst predictions based on past performance.
The through train between Shanghai and Hong Kong has arrived! Mainland investors can invest in Hong Kong ‘H’ shares, and the rest of the world can invest in Shanghai ‘A’ shares. In this short video, discover how to get the information you require in Refinitiv Eikon using theShanghai-Hong Kong Stock Connect app.
{"policylink":"/content/mytr/en/policies/training-portal/riskmanagementsolutionstraininghome/worldcheckonetraining.html","linktext":"Learn More","link":"/content/mytr/en/policies/training-portal/riskmanagementsolutionstraininghome/worldcheckonetraining.html","UserRole":[]},{"policylink":"/content/mytr/en/policies/training-portal/riskmanagementsolutionstraininghome/enterpriseriskmanagertraining.html","linktext":"Learn More","link":"/content/mytr/en/policies/training-portal/riskmanagementsolutionstraininghome/enterpriseriskmanagertraining.html","UserRole":[]},{"policylink":"/content/mytr/en/policies/training-portal/riskmanagementsolutionstraininghome/Worldcheckonenew.html","linktext":"Learn More","link":"/content/mytr/en/policies/training-portal/riskmanagementsolutionstraininghome/Worldcheckonenew.html","UserRole":[]},{"policylink":"/content/mytr/en/policies/training-portal/riskmanagementsolutionstraininghome/connectedrisktraining.html","linktext":"Learn More","link":"/content/mytr/en/policies/training-portal/riskmanagementsolutionstraininghome/connectedrisktraining.html","UserRole":[]},{"policylink":"/content/mytr/en/policies/training-portal/riskmanagementsolutionstraininghome/regulatorychangemanagementtraining.html","linktext":"Learn More","link":"/content/mytr/en/policies/training-portal/riskmanagementsolutionstraininghome/regulatorychangemanagementtraining.html","UserRole":[]},{"policylink":"/content/mytr/en/policies/training-portal/riskmanagementsolutionstraininghome/auditmanager.html","linktext":"Learn More","link":"/content/mytr/en/policies/training-portal/riskmanagementsolutionstraininghome/auditmanager.html","UserRole":[]},{"policylink":"/content/mytr/en/policies/training-portal/riskmanagementsolutionstraininghome/screenresolutionservice.html","linktext":"Learn More","link":"/content/mytr/en/policies/training-portal/riskmanagementsolutionstraininghome/screenresolutionservice.html","UserRole":[]},{"policylink":"/content/mytr/en/policies/training-portal/riskmanagementsolutionstraininghome/screeningdeployed.html","linktext":"Learn More","link":"/content/mytr/en/policies/training-portal/riskmanagementsolutionstraininghome/screeningdeployed.html","UserRole":[]},{"policylink":"/content/mytr/en/policies/training-portal/riskmanagementsolutionstraininghome/enhancedduediligencereports.html","linktext":"Learn More","link":"/content/mytr/en/policies/training-portal/riskmanagementsolutionstraininghome/enhancedduediligencereports.html","UserRole":[]},{"policylink":"/content/mytr/en/policies/training-portal/riskmanagementsolutionstraininghome/thomsonreuterskycasaservice.html","linktext":"Learn More","link":"/content/mytr/en/policies/training-portal/riskmanagementsolutionstraininghome/thomsonreuterskycasaservice.html","UserRole":[]},{"policylink":"/content/mytr/en/policies/training-portal/riskmanagementsolutionstraininghome/clientonboarding.html","linktext":"Learn More","link":"/content/mytr/en/policies/training-portal/riskmanagementsolutionstraininghome/clientonboarding.html","UserRole":[]}
[]
[]
