Datastream Training
.html
Want to know more about how Datastream Charts work? Or how to make the most of the latest features in Datastream? Find out more here. Training includes topics such as The Info Line, Charting and more.
This course covers the following topics:
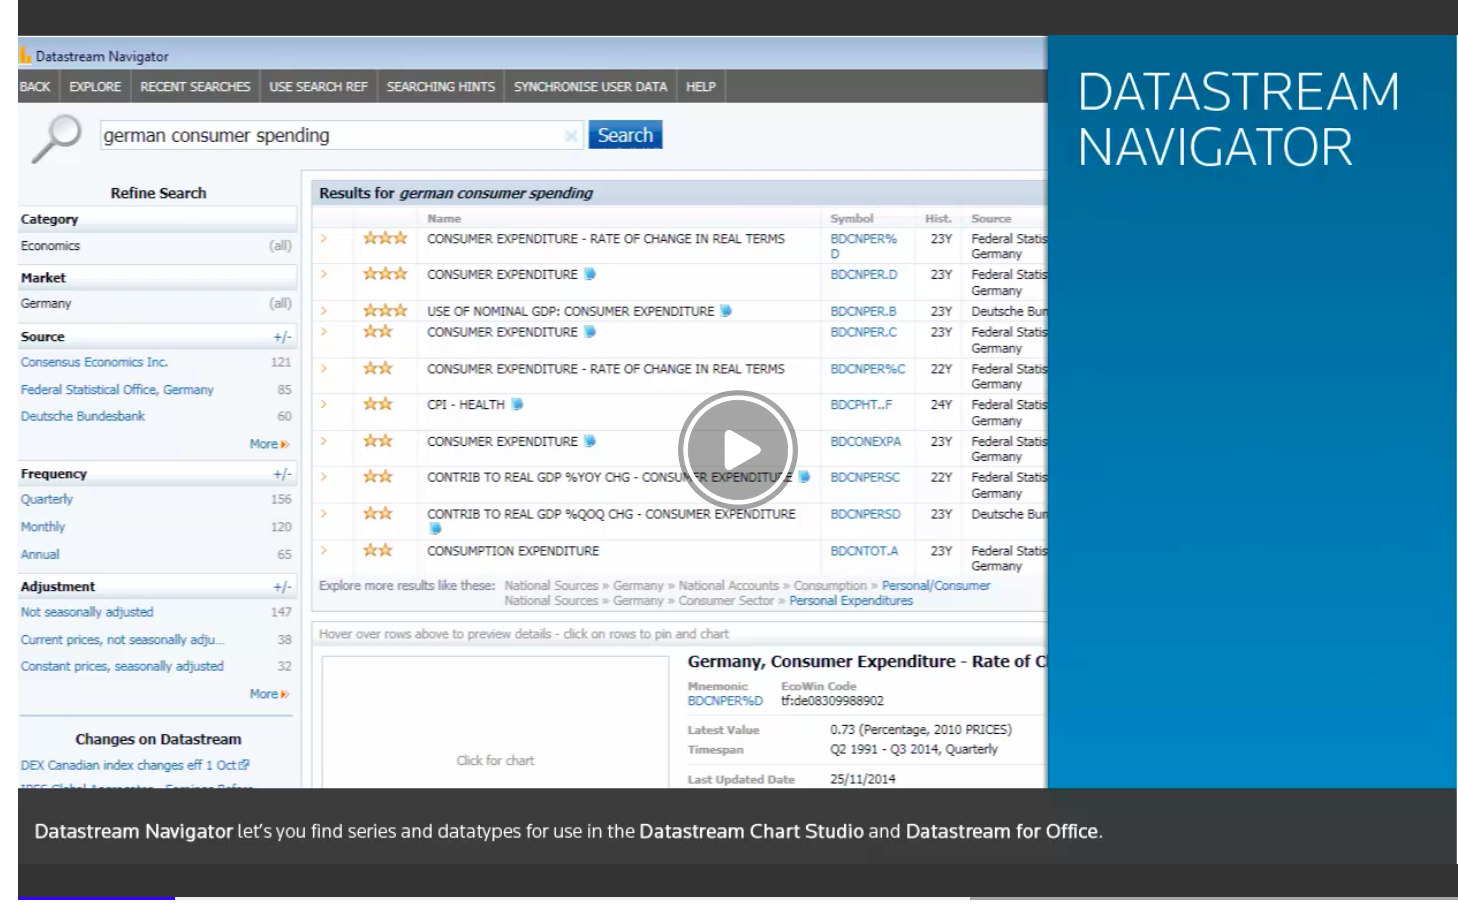
- How to Access Navigator Search (1:17)
- Using Free Text Search to find Codes (3:49)
- Help with using the Free Text Search (2:55)
- Using Navigator to Preview Equity Datatypes (1:55)
- Using Explorer to Find Codes (2:08)
- About the Search Results (1:52)
- Finding Datatypes (2:22)
This module covers the following topics:
- Access Datastream Charting (01:09)
- About the Chart page (04:00)
- About the Library tab (06:16)
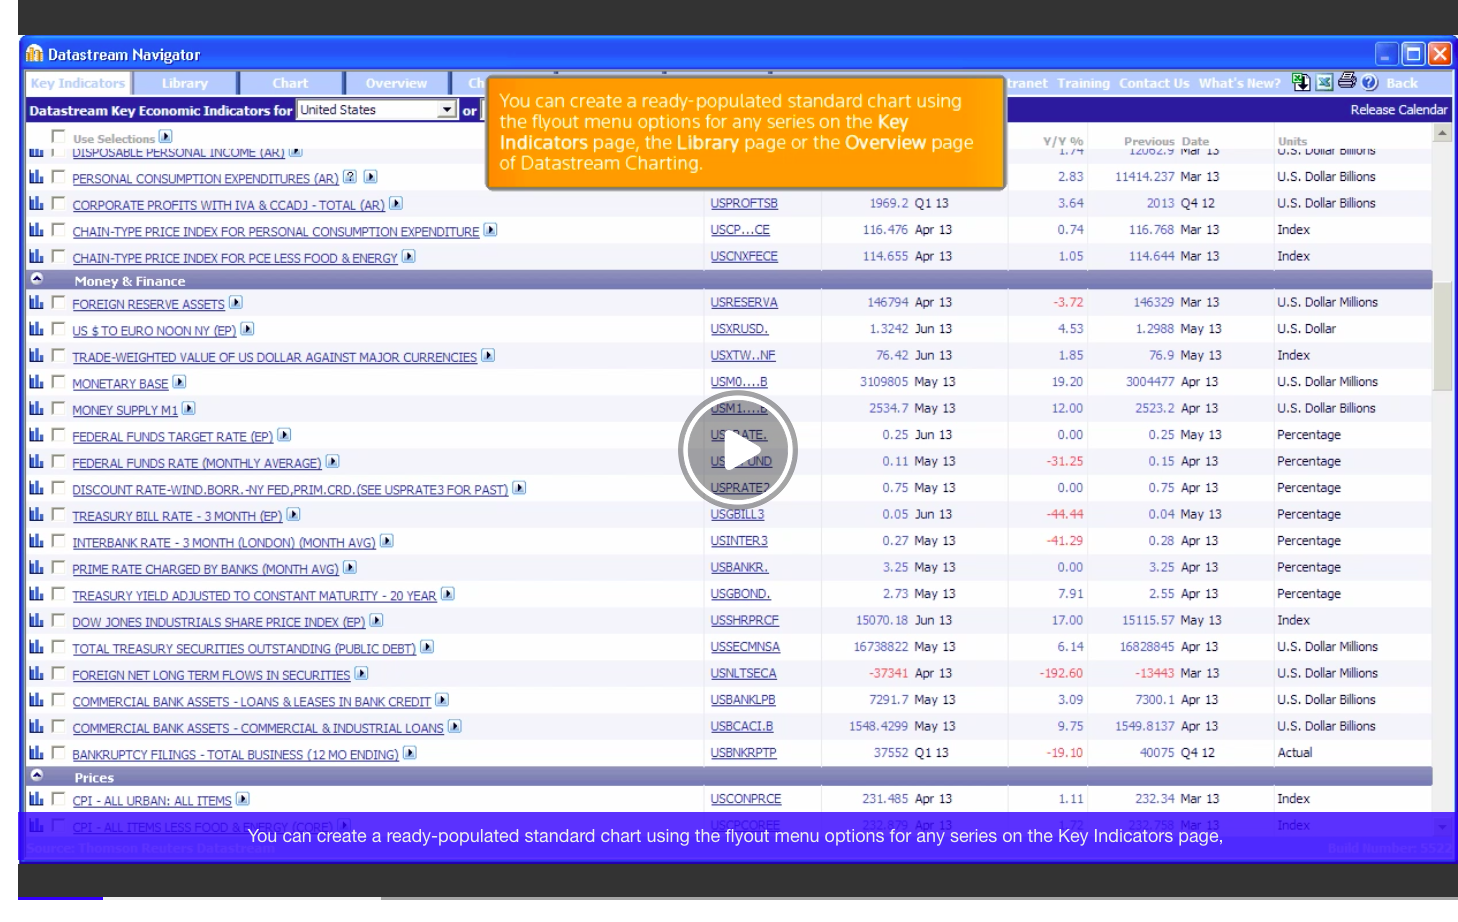
- Navigating Key Indicators and Exporting Data to Excel (04:08)
- Other Datastream Charting Tabs(01:07)
- Help and Support (01:05)
This module covers the following topics:
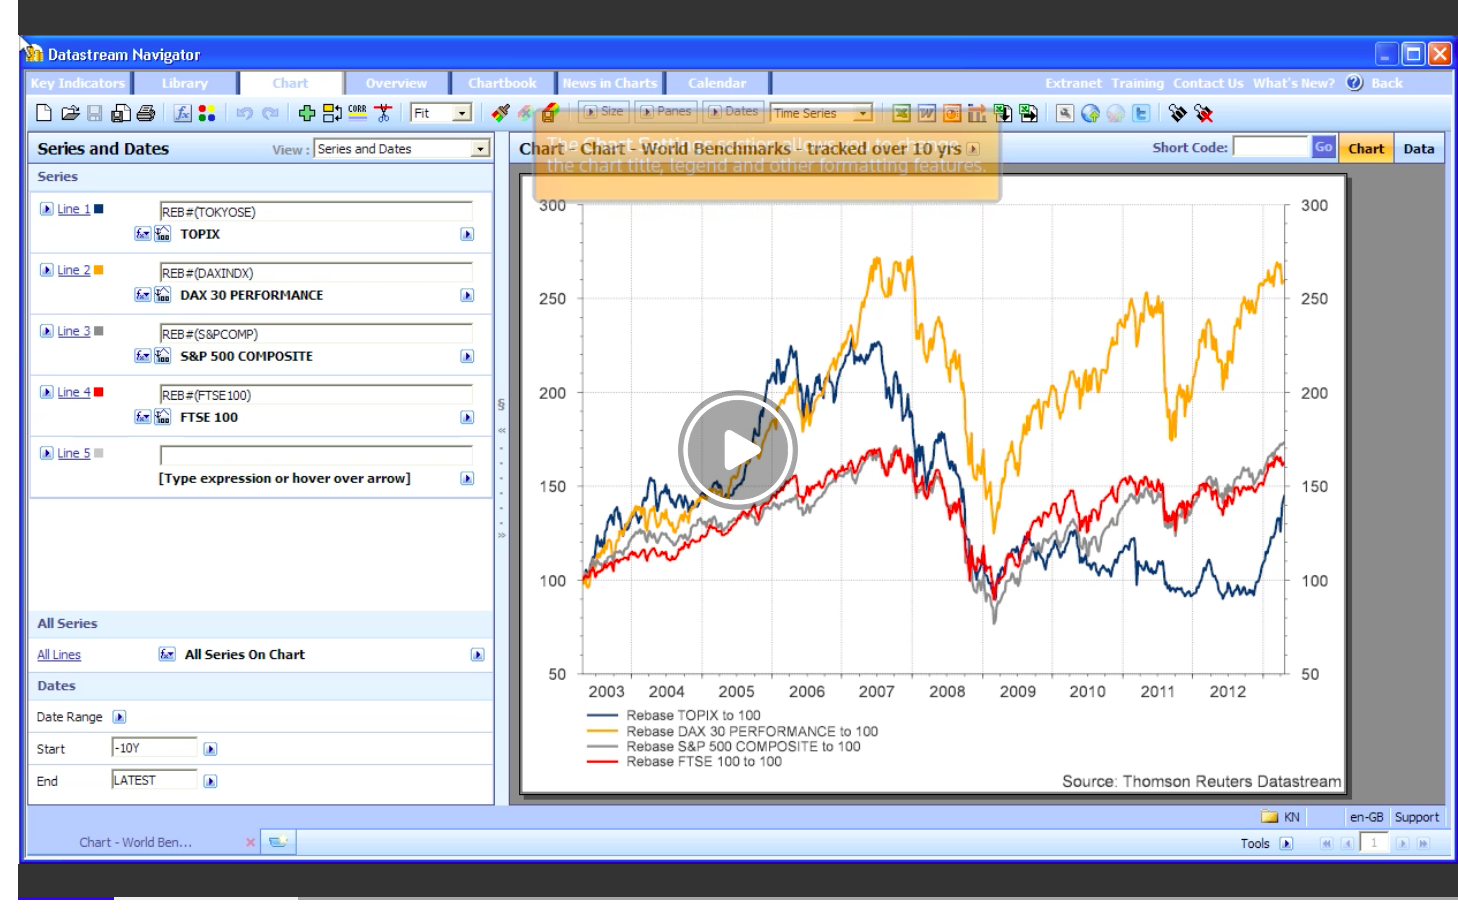
- Create a New Blank Chart (02:31)
- Apply Datatypes (02:19)
- Apply Currency Conversion to All Series (01:37)
- Apply Functions (02:41)
- Change the Date Range (02:12)
- Change Chart Settings (03:17)
- Rebasing Charts (01:07)
- Save a Chart (02:30)
- Load a Saved Chart (01:53)
- Project: How do I rebase a Chart(03:25)
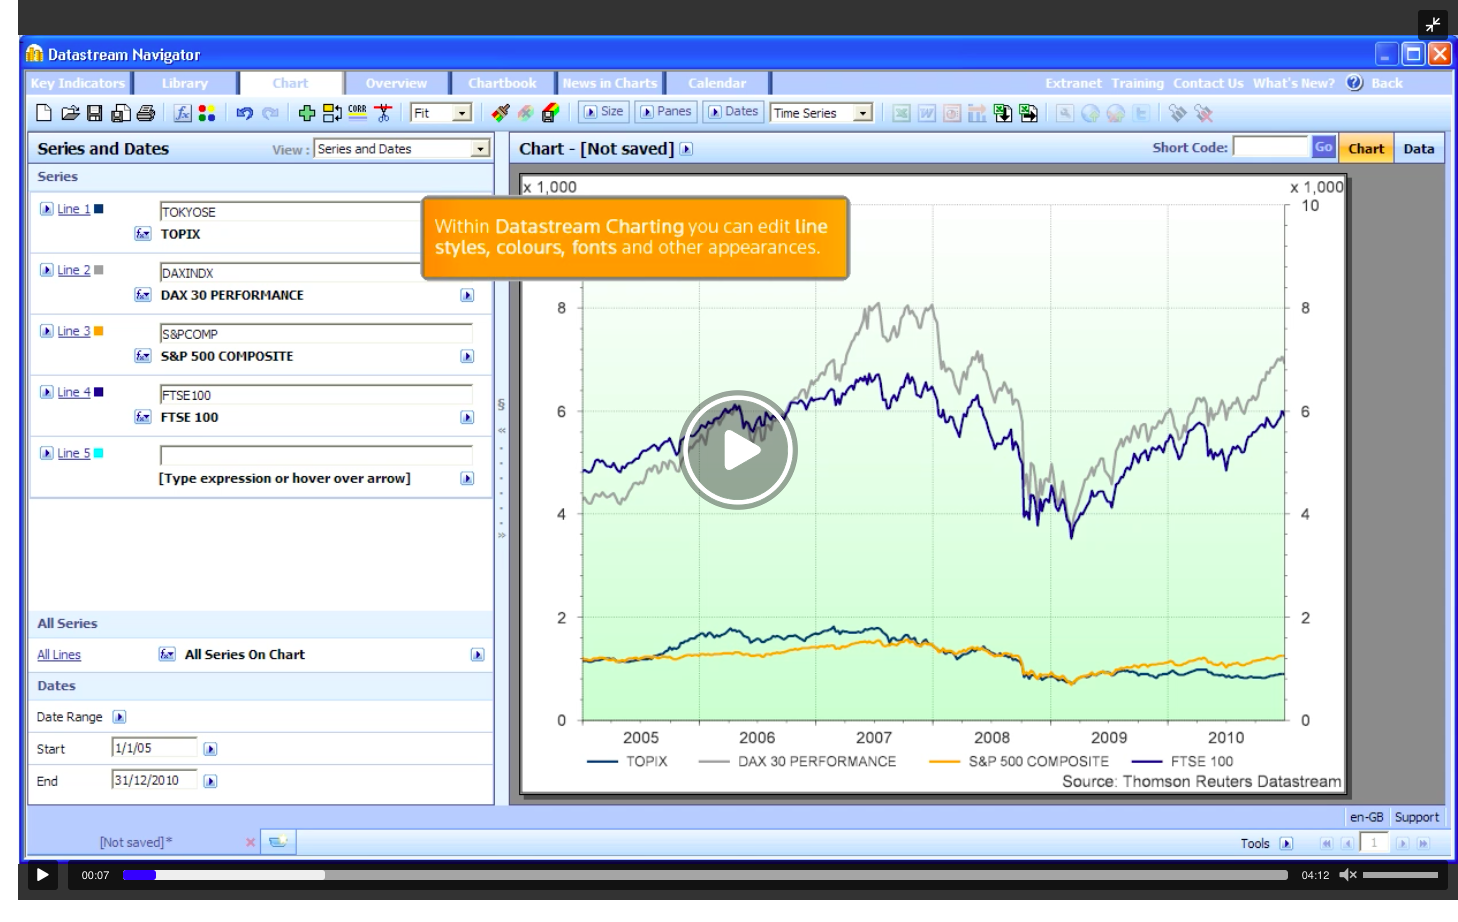
This module covers the following topics:
- Changing Chart Settings (03:05)
- Customizing Chart Legends (01:26)
- Customizing Chart Axes (01:32)
- Changing a Locked Setting (01:28)
This module includes the following topics.
- Create a New Chart Style (04:35)
- Apply a Style to a Chart (01:30)
- Apply a Style to Multiple Charts (01:05)
- Editing Several Charts at once (01:35)
- Setting a Default Style (01:17)
- Using Transparency Settings on a Chart (02:10)
- Change a Locked Setting (01:18)
- Save a Change to an Existing Style (01:34)
- Apply Datastream Styles to Charts in Excel (01:16)
Refinitiv has teamed up with Fathom Consulting to offer Datastream customers access to Fathom’s analytical content through a new library of Fathom charts.
This module demonstrates:
- Creating a multi-pane chart (1:34)
- Customizing a multi-pane chart (4:43)

This module demonstrates:
- About Static Bar Charts (1:31)
- Importing Charts and Tables (4:13)
- Adding date points to a Static Bar Chart (2:55)
- Changing the layout of a Static Bar Chart (3:22)
- PROJECT: Use a Static Bar Chart to Analyze Economic Data (5:18)
This module demonstrates:
- Applying Forecasts to a Datastream Chart (2:12)
- Editing a User Forecast (2:47)
- PROJECT: Apply Forecasts to an Economics Chart (4:26)
This module demonstrates:
- Applying Slicing to a Chart (01:40)
- Edit and Customize a Sliced Chart (02: 47)
- Using Slicing and Seasonality to Analyze Economic Data (2:55)
- Apply Slicing to an Economics Chart (2:58)
This module demonstrates:
- Creating a Static Scatter Chart (3:53)
- Annotating Points on a Static Scatter Chart (2:54)
- Customizing a Static Scatter Chart (3:26)
- PROJECT: Use Static Scatter Charts to Analyze Economic Data (5:41)
This module demonstrates:
- Creating a Time Series Scatter Chart (1:20)
- Customizing a Scatter Chart (3:02)
- Adding Series and Relevant Information to a Time Series Scatter Chart (4:35)
- Annotating a Scatter Chart (3:35)
This OnDemand video explains how customers can use DFO - Datastreams add-in for Microsoft Office - to build complex models and reports that can be linked straight into Excel.
This course covers the following topics:
- Key Benefits of Request Tables (1:44)
- Creating a Request Table (6:16)
- Creating a Chart Request (2:26)
- Using pre-built Tearsheets (1:41)
This course covers the following topics:
- Export a Chart to Microsoft Excel (1:54)
- Export a Chart to Microsoft Word (2:10)
- Export a Template to Microsoft Office (1:40)
- Export Multiple Charts to Microsoft Office (2:23)
- Export a chart as an Image File (2:45)
- Share a Live Chart URL (2:27)
- Share a chart using the Edit URL (1:46)
- Set Sharing Preferences (2:05)
- Refresh charts from Microsoft Office (2:09)
- Running a template from Microsoft Excel (1:26)
- Using the Chart Manager (4:25)
- Refresh locally-stored chart images (0:57)
This course is an introduction to working with Functions and Expressions in Datastream Charting and Datastream for Office. This course covers the following topics:
- About Datastream Functions and Expressions (3:53)
- About Static Functions (3:30)
- About Moving Format Functions (3:12)
- Working with Calendar Functions (4:39)
- Using the Rebasing function in a Time Series Request (3:28)
- About the Expression Builder (1:49)
- Using the Expression Builder to create a simple expression (3:37)
- Using a Custom Expression in Datastream(1:46)
- Using a Custom Expression in Datastream Charting (1:22)
This module covers the following topics:
- About User Created Lists (1:46)
- Create a List from a Range (2:38)
- Creating a List from Datastream Navigator (2:02)
- Accessing User Created Lists from a Request (1:06)
- Accessing User Created Lists from a Datastream Charting Template (1:04)
This course covers the following topics:
- About Annotations (1:11)
- Annotate a series with Substitutable Text (3:14)
- Create Complex Annotations using Substitutable Text (2:07)
- Add Text Boxes (1:27)
- Add a Recession Band (4:05)
- Add Horizontal and Vertical Annotation Lines (3:01)
- Add Freehand Lines (1:47)
- Add Circles and rectangles (2:36)
- Add Markers to Lines (2:13)
- Change Annotation Styles (3:32)
This course includes the following topics:
- Setting Sharing Preferences (1:54)
- Sharing a Live Chart URL (2:08)
- Sharing a Chart using the Edit URL (1:14)
This course covers the following topics:
- Using the line correlation dialog to set a correlation
- Setting the correlation spectrum
- Applying best fit shift to a correlation chart
- Finding sample correlation charts in the Datastream Library
Correlation is a powerful tool that allows you to analyze the relationship between multiple time-series. This OnDemand video showcases how to use Datastream Charting (DSCHART) to create your own correlation charts.
This course covers the following topics:
- Accessing the User Created Time Series template (1:20)
- Create a User Created Time Series (5:10)
- Accessing a User Created Time Series from Datastream Charting (1:08)
- Adding a User Created Time Series to a Request (1:22)
- Editing a User Created Time Series (3:00)
This course covers the following topics:
- About User Created Indices (1:15)
- Creating an Index in Under a Minute (1:30)
- Creating an Index from a List in Excel (3:10)
- Using the UCI Template to Create and Edit an Index (5:51)
- Creating an Index from a Data Table (2:52)
- Editing an Index from the UCI Template(2:45)
This video will demonstrate how to find Bond Indices and constituent lists to support selecting asset allocations, performance benchmarking and constructing structured products. Datastream and leading index suppliers including Iboxx and Merrill Lynch provide comprehensive coverage and history for this essential data.
Refinitivs Asset4 provides a one-stop shop of ESG information which may be accessed via Datastream, allowing users to seamlessly combine and analyze ESG data with financial metrics. Watch this video to learn how to access and use this information in Datastream. Total Running Time 3:17
This course covers the following topics:
- Adding a Chart to a Shared Collection (02:58)
- Adding a Chart to a Private Collection (01:55)
- Editing Charts in a Collection (02:02)
- Exporting Charts from a Collection (01:32)
{"policylink":"/content/mytr/en/policies/training-portal/datastreamtrainingtiles/workingwithcharttypestwo.html","linktext":"Learn More","link":"/content/mytr/en/policies/training-portal/datastreamtrainingtiles/workingwithcharttypestwo.html","UserRole":[]},{"policylink":"/content/mytr/en/policies/training-portal/datastreamtrainingtiles/workinginmsofficetwo.html","linktext":"Learn More","link":"/content/mytr/en/policies/training-portal/datastreamtrainingtiles/workinginmsofficetwo.html","UserRole":[]},{"policylink":"/content/mytr/en/policies/training-portal/datastreamtrainingtiles/analyticsandtoolstwo.html","linktext":"Learn More","link":"/content/mytr/en/policies/training-portal/datastreamtrainingtiles/analyticsandtoolstwo.html","UserRole":[]},{"policylink":"/content/mytr/en/policies/training-portal/datastreamtrainingtiles/exploringthedatacontenttwo.html","linktext":"Learn More","link":"/content/mytr/en/policies/training-portal/datastreamtrainingtiles/exploringthedatacontenttwo.html","UserRole":[]},{"policylink":"/content/mytr/en/policies/training-portal/datastreamtrainingtiles/tipstricksandideastwo.html","linktext":"Learn More","link":"/content/mytr/en/policies/training-portal/datastreamtrainingtiles/tipstricksandideastwo.html","UserRole":[]},{"policylink":"/content/mytr/en/policies/training-portal/datastreamtrainingtiles/datastreamtraininglearnthebasics.html","linktext":"Learn More","link":"/content/mytr/en/policies/training-portal/datastreamtrainingtiles/datastreamtraininglearnthebasics.html","UserRole":[]}
[]
[]