Asset Management
.html
Asset Management
This module includes the following topics:
- Eikon Quick Start (02:50)
- About the Eikon Toolbar (01:59)
- Explore the Eikon Menu (02:22)
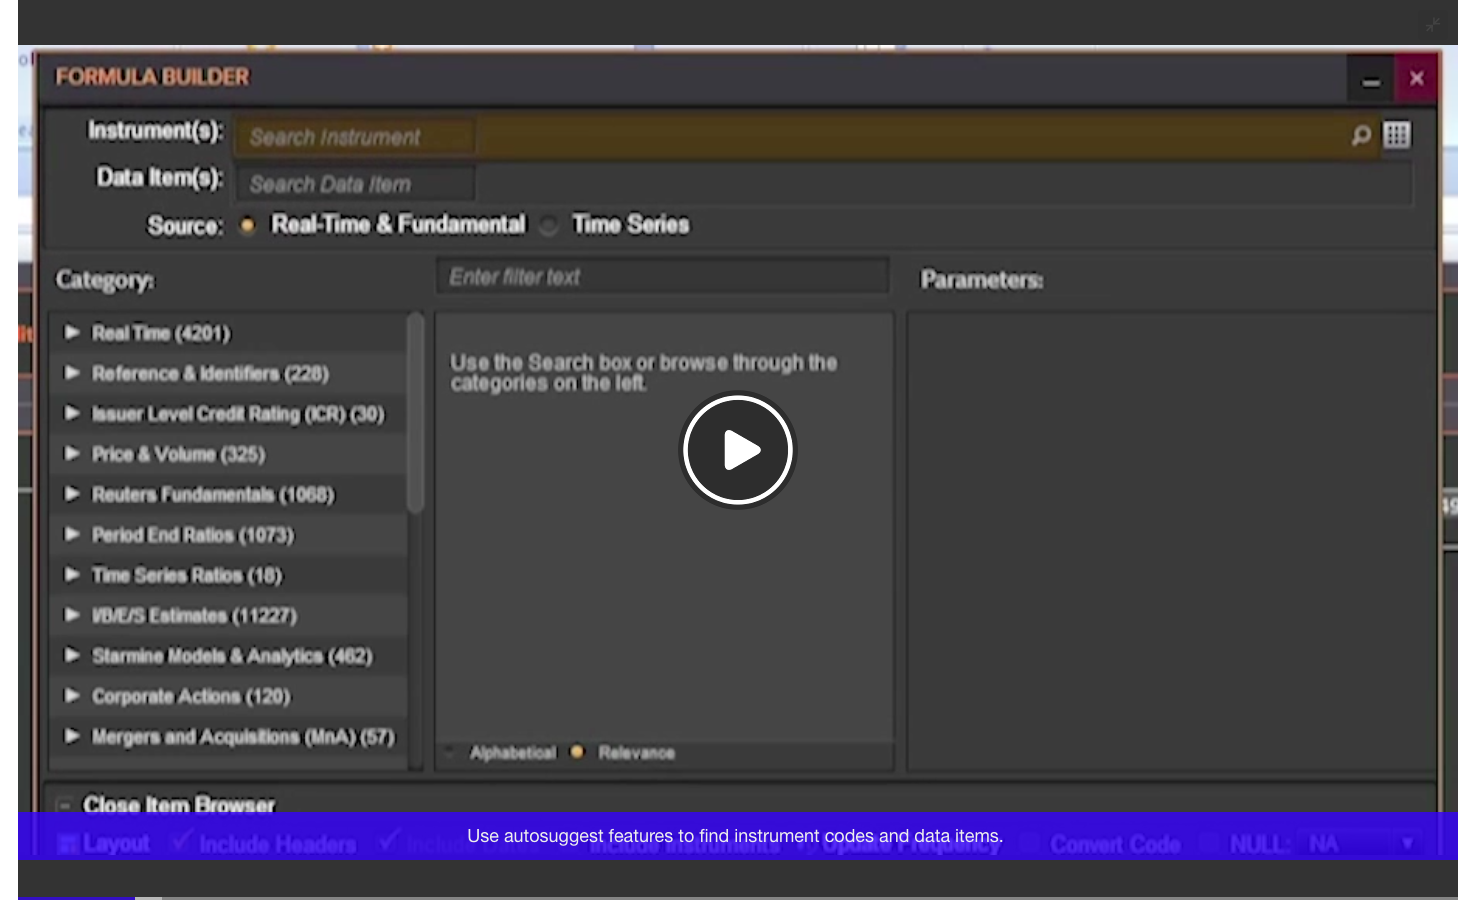
- Using the Search Box to Find Tools and Data (03:51)
- Managing your Workspace (03:13)
- Linking Apps (01:00)
- Getting Help and Support (02:20)
Discover how Eikon version 4 gives you the competitive edge and empowers you to get better ideas to market faster.
This module shows you how to save news stories, research documents, filings and events to My Briefcase (BRIEF), and access them anytime anywhere. (4:11)
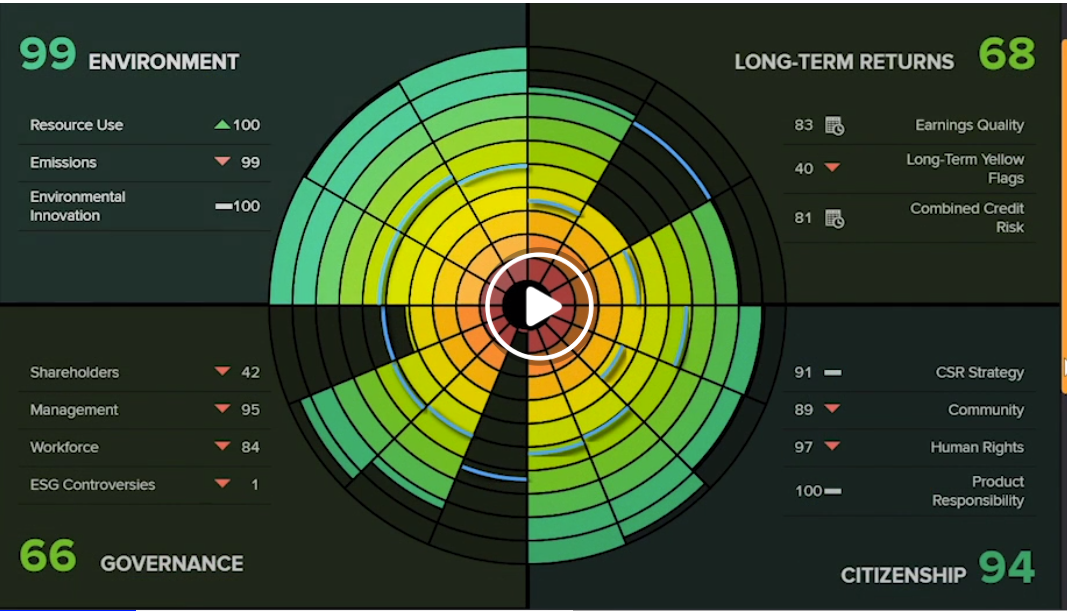
This video provides a detailed overview of the Sustainable Leadership Monitor app. The app enables users to track how companies are scoring on multiple ESG criteria. It also lets you compare how companies are performing against their peers across a wide range of categories.
Quick Reference Card - Top News
Learn how to use the intuitive and customizable News Monitor App
Quick Reference Card - Earnings Season
Quick Reference Card - Economic Monitor
Quick Reference Card - Datastream Chartbook
The Eikon Chart Studies app provides ready-made charts for quick access to powerful analytics and in-depth analysis of financial instruments. Learn how to access and use this app with this quick reference guide.
Learn how to use the Advanced Events Search app, a fully customizable and intuitive search tool that helps you quickly locate historical and upcoming event details.
This course includes the following topics:
- Introduction to the News Monitor (01:15)
- Creating a News Search (2:34)
- Keyword searching (1:38)
- Filters and Sources (1:17)
- Filtering for News by Date (01:24)
- The Headline Highlighter Tool (01:19)
- Customizing the News Monitor (02:41)
- Advanced Search Filters(0:56)
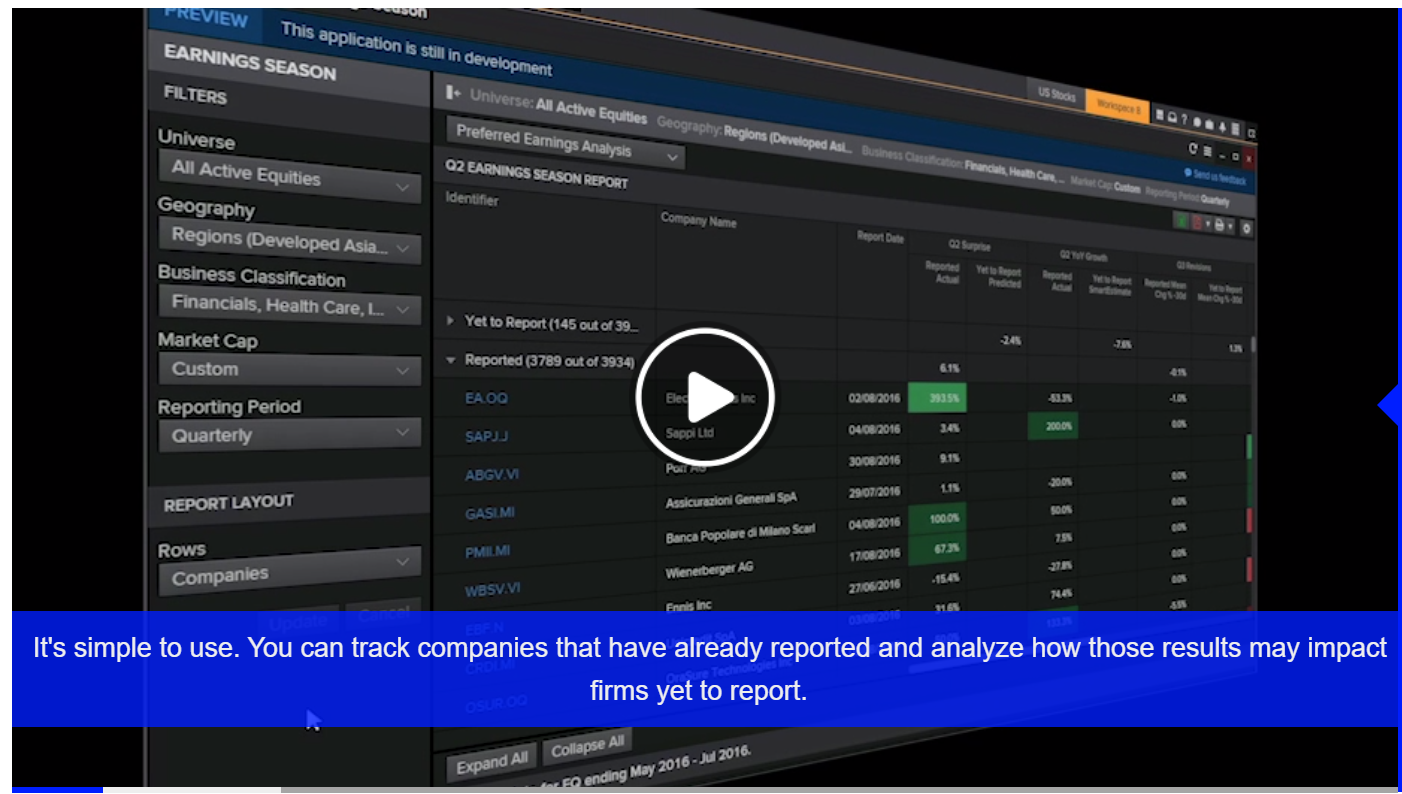
Keep up to date using the Earnings Season App to monitor the current Earnings Season. Identify trends at an aggregate level from companies that have already reported and see how they may impact companies yet to report.
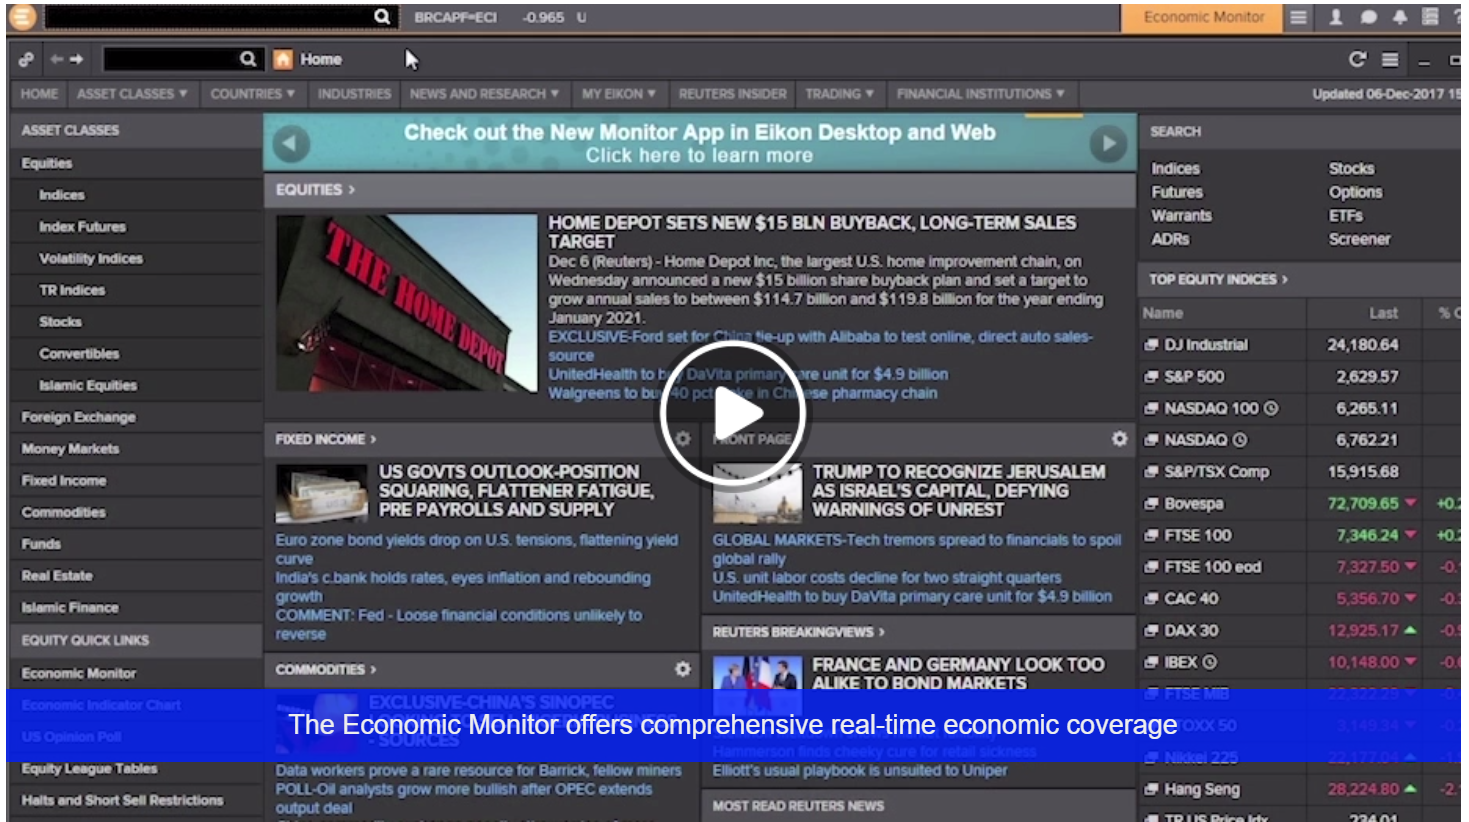
The Economic Monitor (EM) offers comprehensive real-time economic coverage and lets you see what’s affecting the markets and impacting your trading. Discover how to access and use this app.
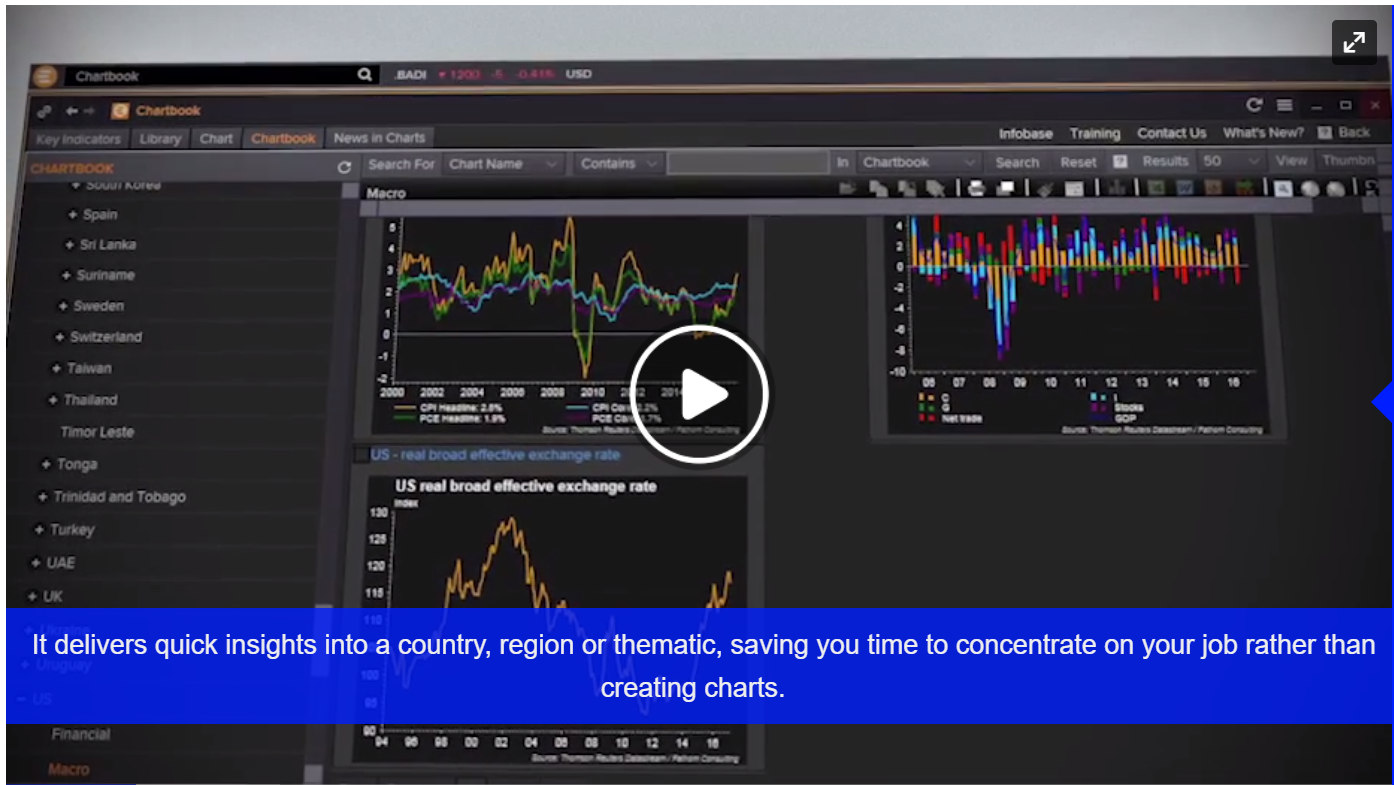
The Chartbook (CBOOK) provides a quick and unique repository of analytical content. It gives you insight into a country, region or thematic, saving you time to concentrate on your job rather than creating charts.
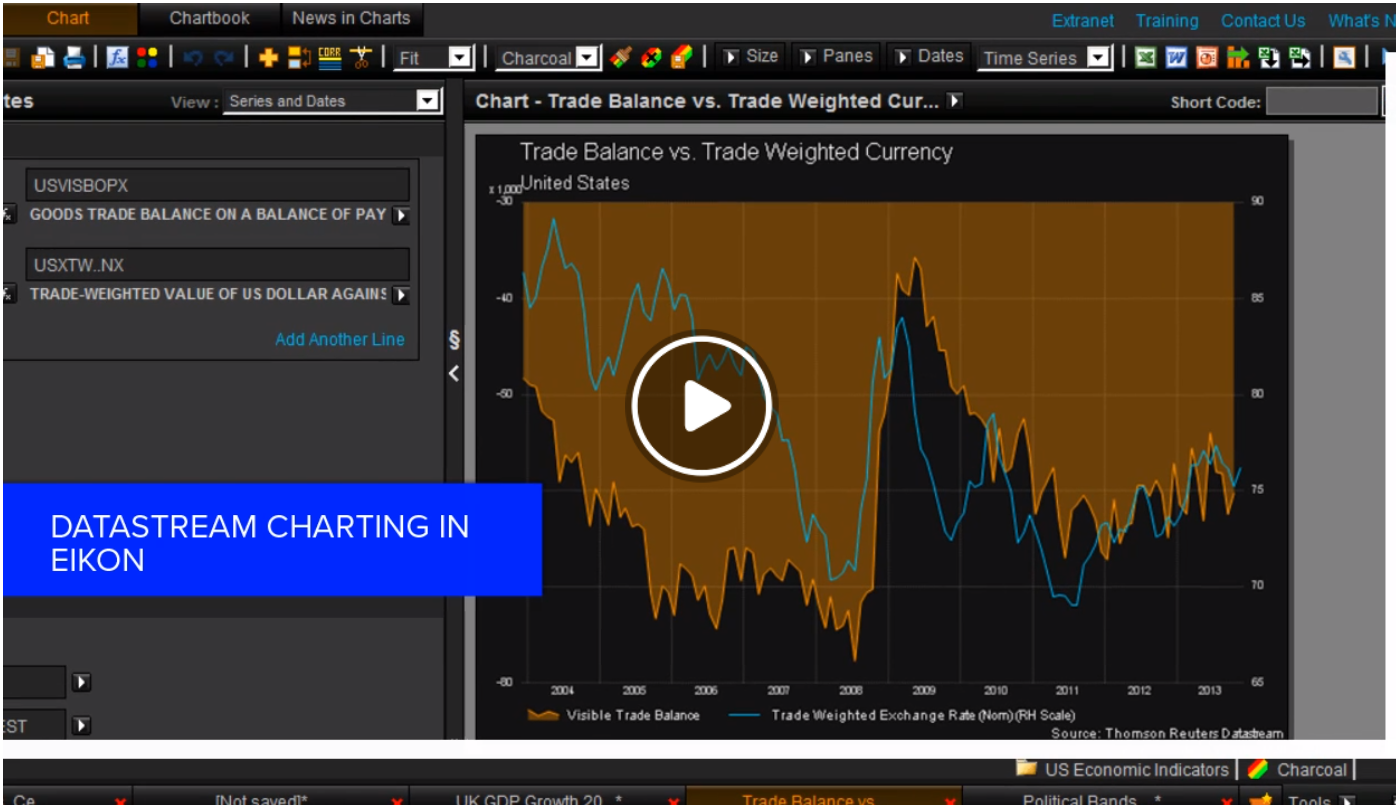
This module includes the following topics:
- About Datastream Charting (02:12)
- Working with Datastream Chart Studio (DSCHART) (02:25)
- Exploring Chart Studio (02:19)
- Apply Datatypes, Currencies and Functions (03:08)
- Changing Chart Settings and Line Styles (02:00)

This module includes the following topics:
- Getting Started With The Macro Explorer App (03:10)
- Creating a Screen and Exporting Tables (03:23)
- Visualizing Trajectories and Trends (03:02)
- Filtering on Sectors and Securities (01:42)
- Using the Real-Time Monitor (01:25)
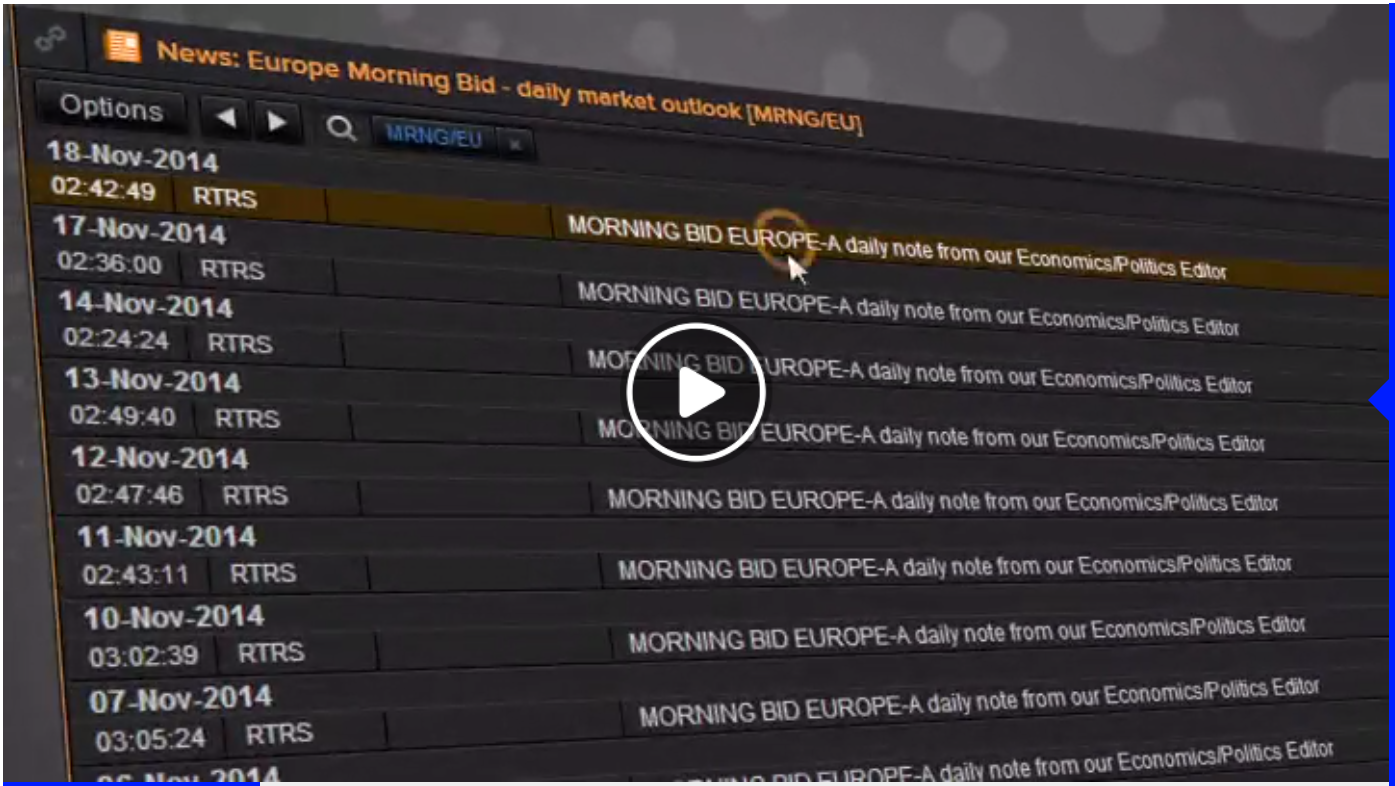
Learn how to view and create an alert for the Morning bid report which provides a view of the day’s important economic and political news from Reuters journalists.
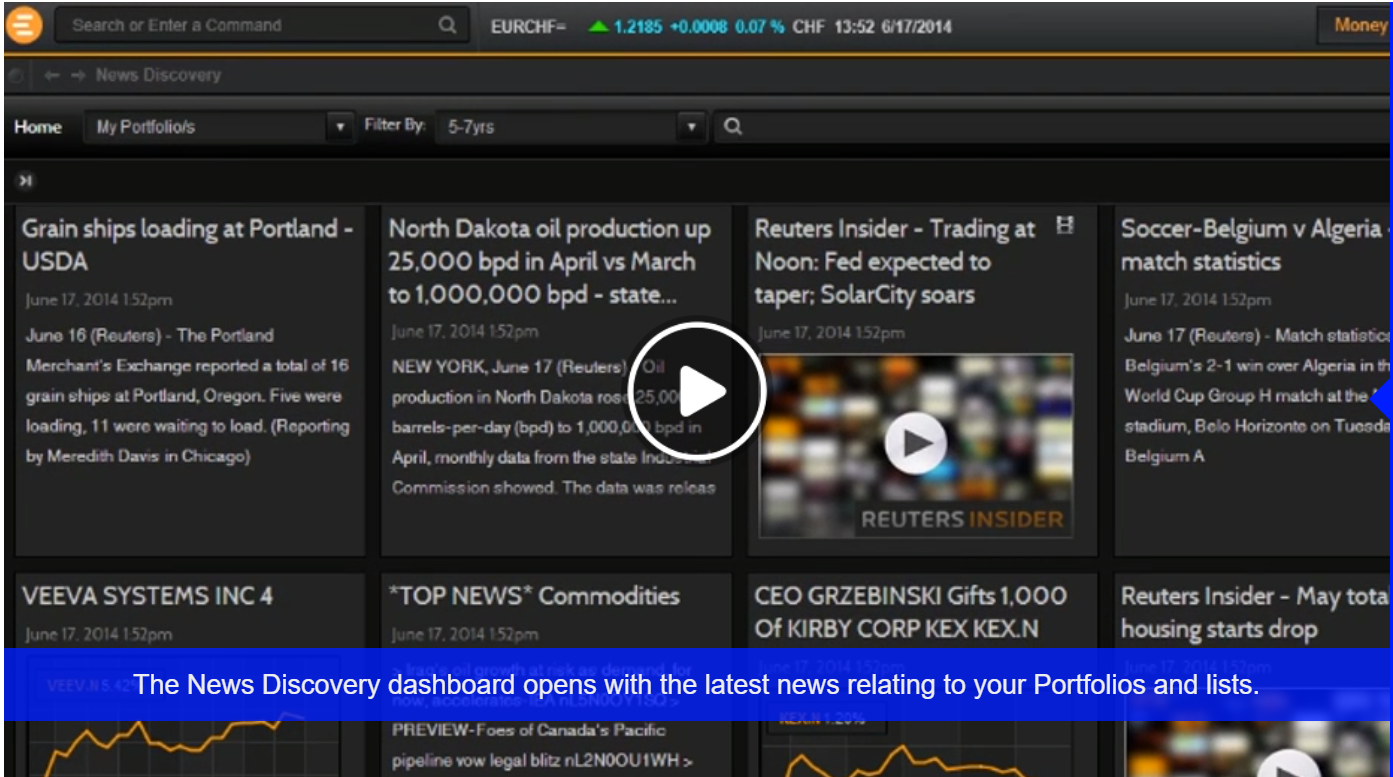
News Discovery offers a different insight of NewsWires, Global Press, and Reuters Top News through data visualization. It Provides streaming and historical news enhanced by charts, videos and tweets. Filter by story sentiment, by date and time as well as view news on the companies in your portfolios.
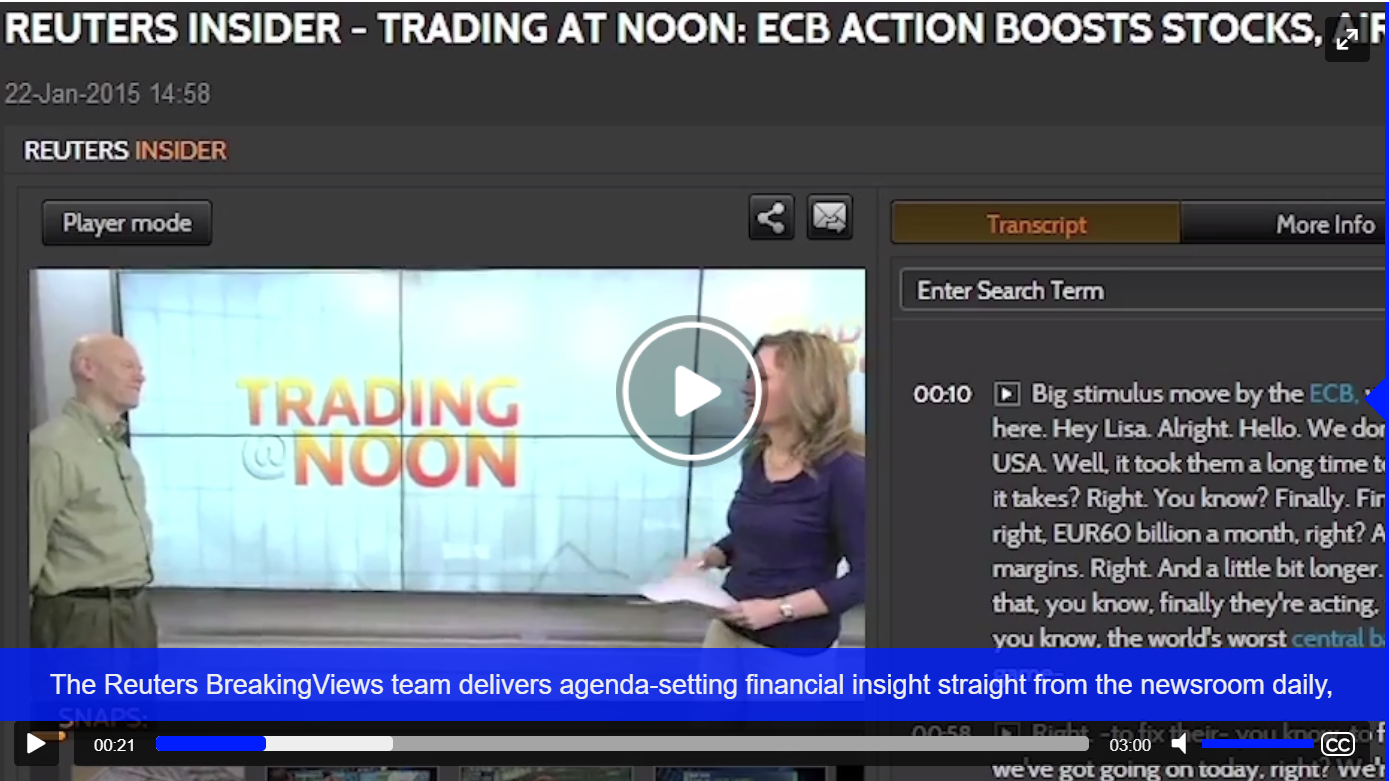
Discover how easy it is to access Reuters Insider video content in Eikon

Meet Greg Harrison, Senior Research Analyst at Thomson Reuters. Find out how he uses Eikon to view earnings estimates, plot growth trends, and analyze historical earnings surprises. Discover the SmartEstimate which weights analyst predictions based on past performance.
The new Macroeconomic Overview gives you direct access to all economic indicators available for your selected country.

In this video discover how Thomson Reuters Healthcare Intelligence leverages our world class Cortellis content allowing you to increase productivity as well as improve efficiency, accessibility and accuracy of your research. Learn how to access both financial data available in Eikon alongside our robust Cortellis data, leading to more impactful investment decisions.
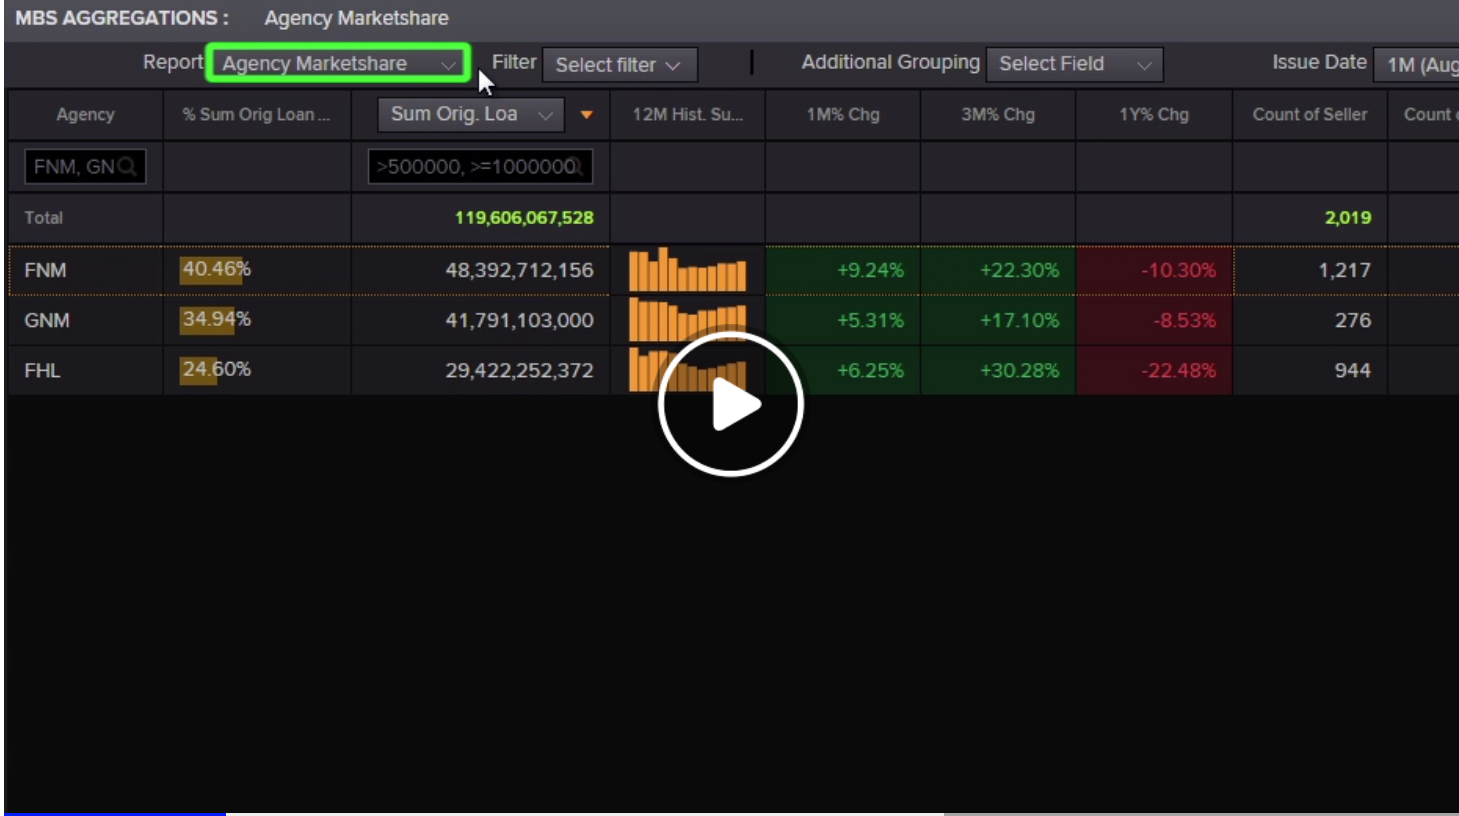
The MBS Aggregations App delivers complete agency mortgage issuance data sourced from loan level disclosures.
Learn how to use the Industry app to view consolidated industry and quickly scan through market moving information.
Quick Reference Card - Search and Discover
Quick Reference Card - Screener
Learn how to use Watchlist Pulse to quickly view the most significant information on your portfolio.
Do you want a top-down view of the market and to be able to easily analyze and identify stocks that fulfill your Investment requirements?
The Industry App lets you explore industries and sectors and can provide a wealth of valuable information, from Performance Data to News and key Metrics. Watch this video to learn more.
With the Search and Discover App in Eikon you can Increase your research productivity with one click search across multiple financial unstructured content sets

This module includes the following topics:
- Introduction to Screener
- Using simple filters to create a screen
- Applying Advanced Filters to a screen
- Working with the Scatter Chart view
- Using Ownership Data in the Screener
- Screener Quick Tips
- Importing and Exporting
- Working with templates

In this video discover how Watchlist Pulse (PULSE) brings together Thomson Reuters proprietary content and analytics to make it easier for you to identify what will have an impact on your coverage list today. Total Running Time: 3:03
Tim Gaumer , Director of Fundamental Research, discusses how to use StaMine's advanced quantitative analytics inline with the Eikon Screeener tool to generatae your next great investement idea.
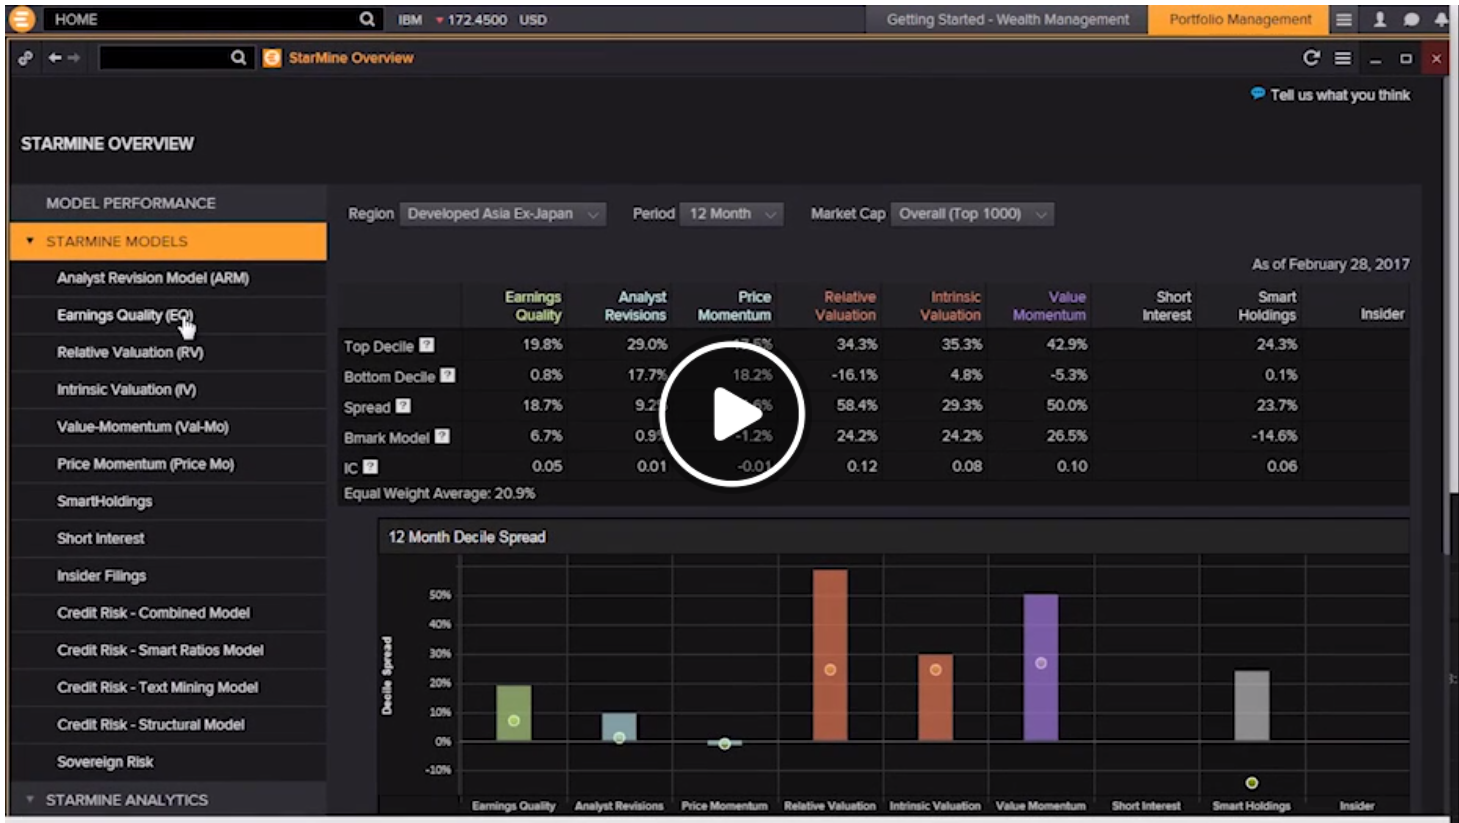
The StarMine Overiew app is the best place to learn about the StarMine suite of quantitative/ analytical models. Rather than having to read through a long document use the overview to get a high-level understanding of how the models work. Learn how to identify in a instant regional performance versus the benchmark by taking a look at the overall Model Performance. Watch this video to learn more.
If you'd like more information about StarMine Alpha Models, start here. In just 7 minutes, Stephen Malinak describes each of the StarMine Quant Models in Eikon.
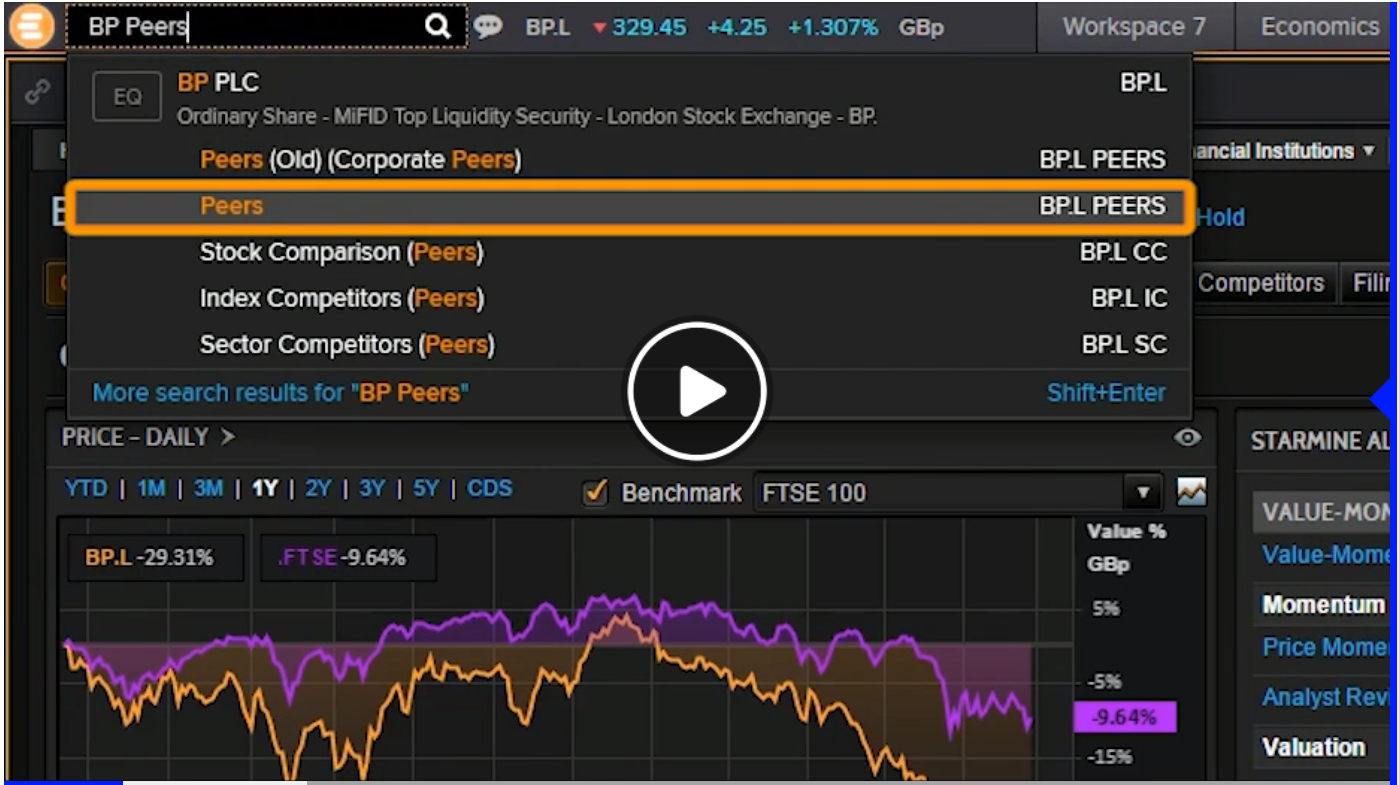
Use the company Peers view (PEERS) to look at major competitors across Sector, Index or define your own lists. View Peer comparison tables and key metrics to assist in idea generation and fundamental analysis.
Learn how to use the Advanced Research Search app to find the research you need using a host of search parameters, including company, portfolio, industry, broker, analyst, country/region, portfolio, keywords, page count, and more.
Quick Reference Card - Company Fundamentals
Learn how to use the new Statement and Detail views in the Estimates App.
Learn how to use the Ownership App to view the most complete global Share Ownership and Profiles data in the industry.
Document: Eikon for Microsoft Office Quick Start Guide
Quick Reference Card - ESG Data
Learn how to use the Chart app in Eikon which includes key analytical tools just a mouse click away and shortcuts for expert users.
Learn how to use the Monitor App to watch instruments and multiple portfolios across all asset classes in real time.
Learn how to use the Advanced Filings Search which provides a quick and easy way to perform a comprehensive and granular search of the filings environment.
Learn how to use the The Routines App to quickly and easily navigate to critical pages and tools that will streamline your daily workflow and increase productivity.
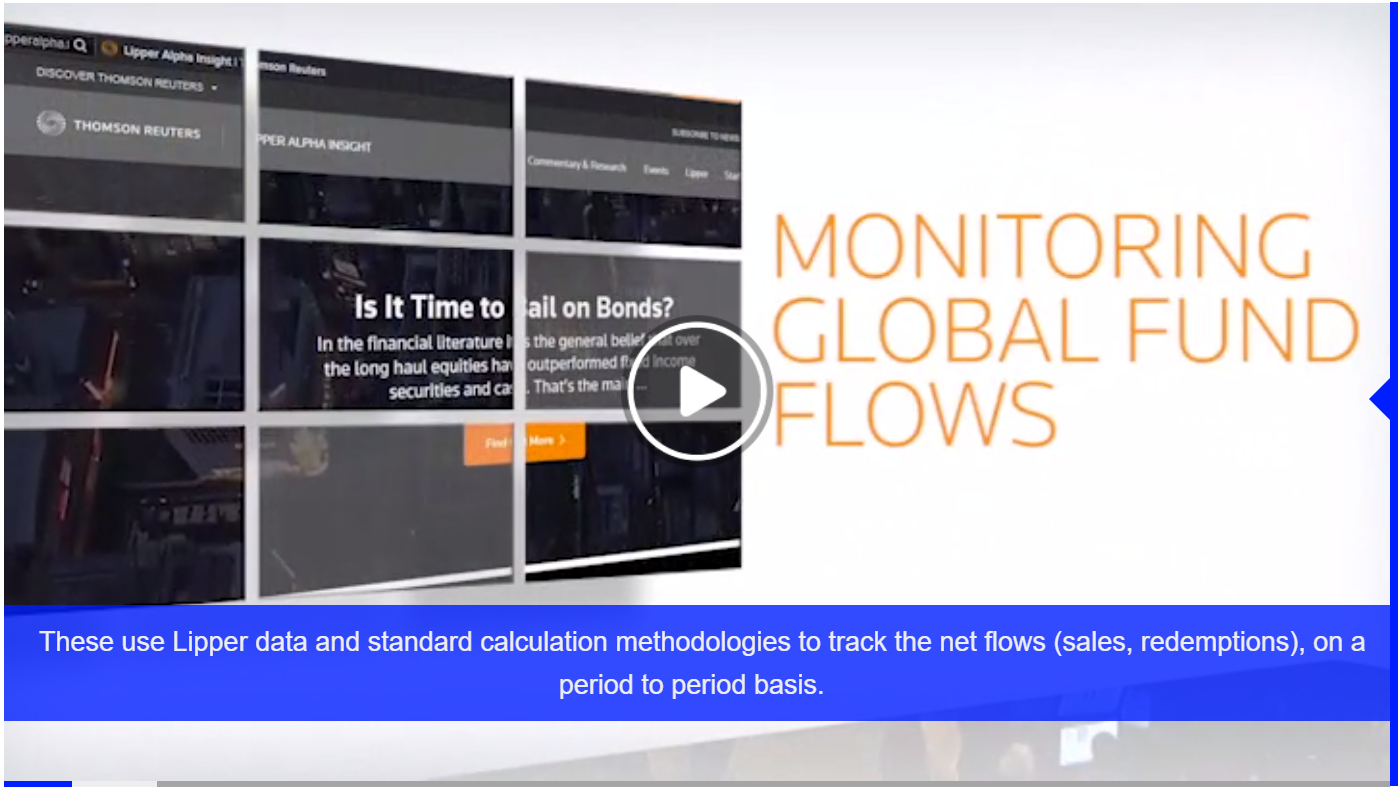
Understand how you can utilise the Global Fund Flows (FlOWS) app in Eikon. Track global fund flows, historical Flow and Total Net Assets data. Easily produce coverage reports which can be shared with your colleagues and clients. [0:01] Introduction [0:31] How to access the Global Fund Flows App [0:42] About the Home Page [1:10] The Global Fund Flows Map [1:39] The Reports Page [2:51] The Funds Page [3:21] Viewing Historical Flow & TNA Data [4:01] The Coverage Reports Page [4:51] Getting Help on the Global Fund Flows App [5:20] Total Course Time Global Fund Flows.pdf
The Fund Screener (FSCREEN) within Eikon is a powerful tool. It enables you to quickly and simply explore the entire global Lipper funds universe. Screen for a list of funds that meet your specified criteria and investment objectives. Analyze your list of funds by using pre-defined templates or your own personal templates. Also easily export the data to Excel and view other information such as quantitative analysis, holdings and charts. Watch this learning to find out more.
Learn how to quickly and easily screen for funds that meet your set criteria. Then analyze funds individually and review performance information in more detail. Also take a look at historical information at a glance in a graphical display or download into excel. Create factsheets that can be shared with your clients.
This course covers the following topics:
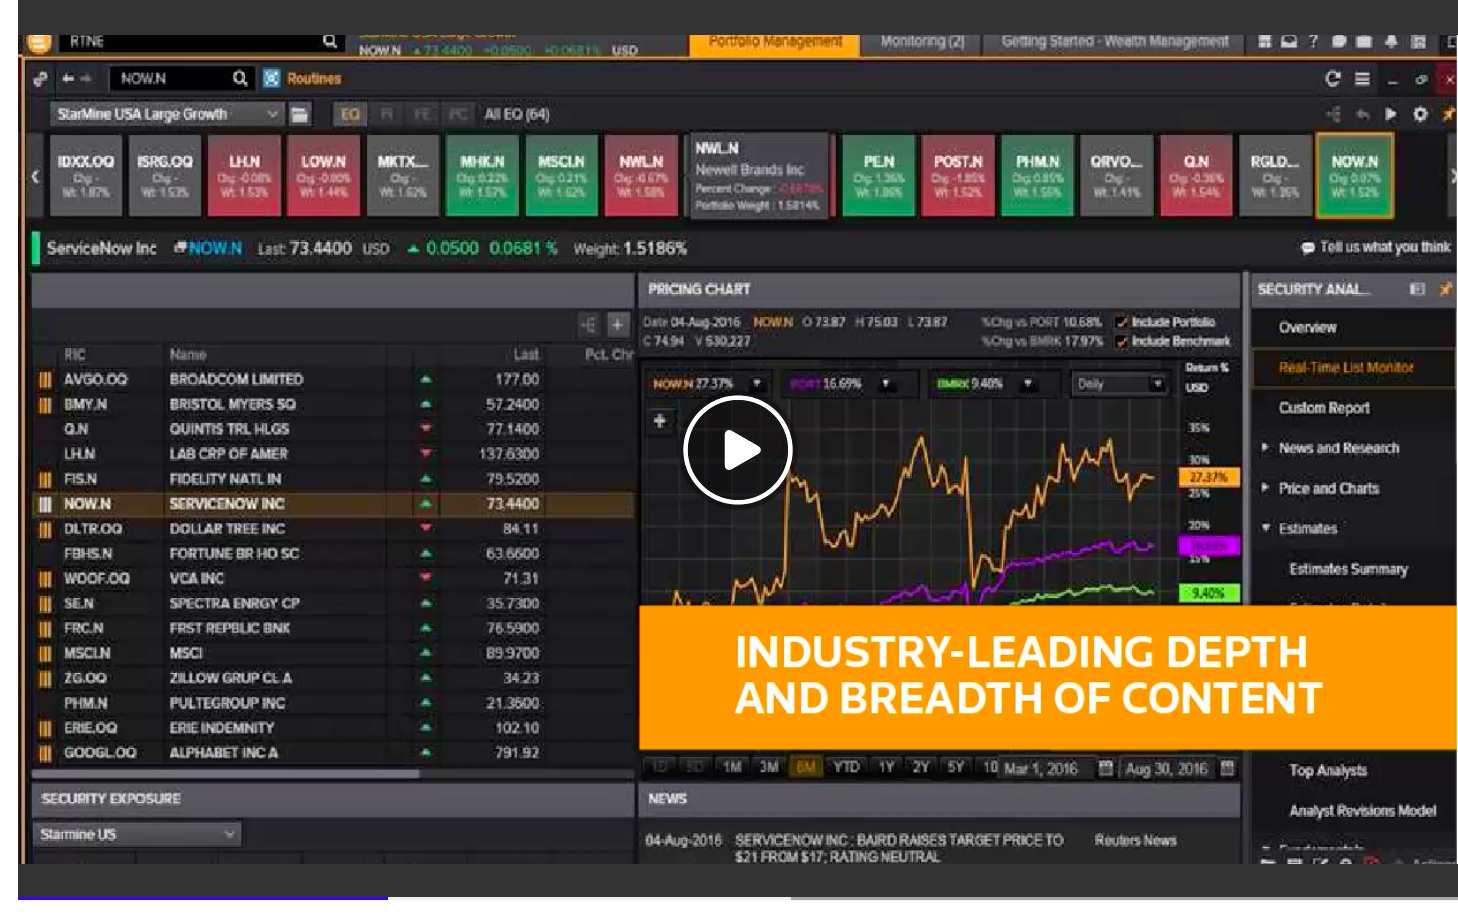
- Benefits of Thomson Reuters Research Collection (1:28)
- Accessing Company Research (3:09)
- Advanced Research Search (2:43)
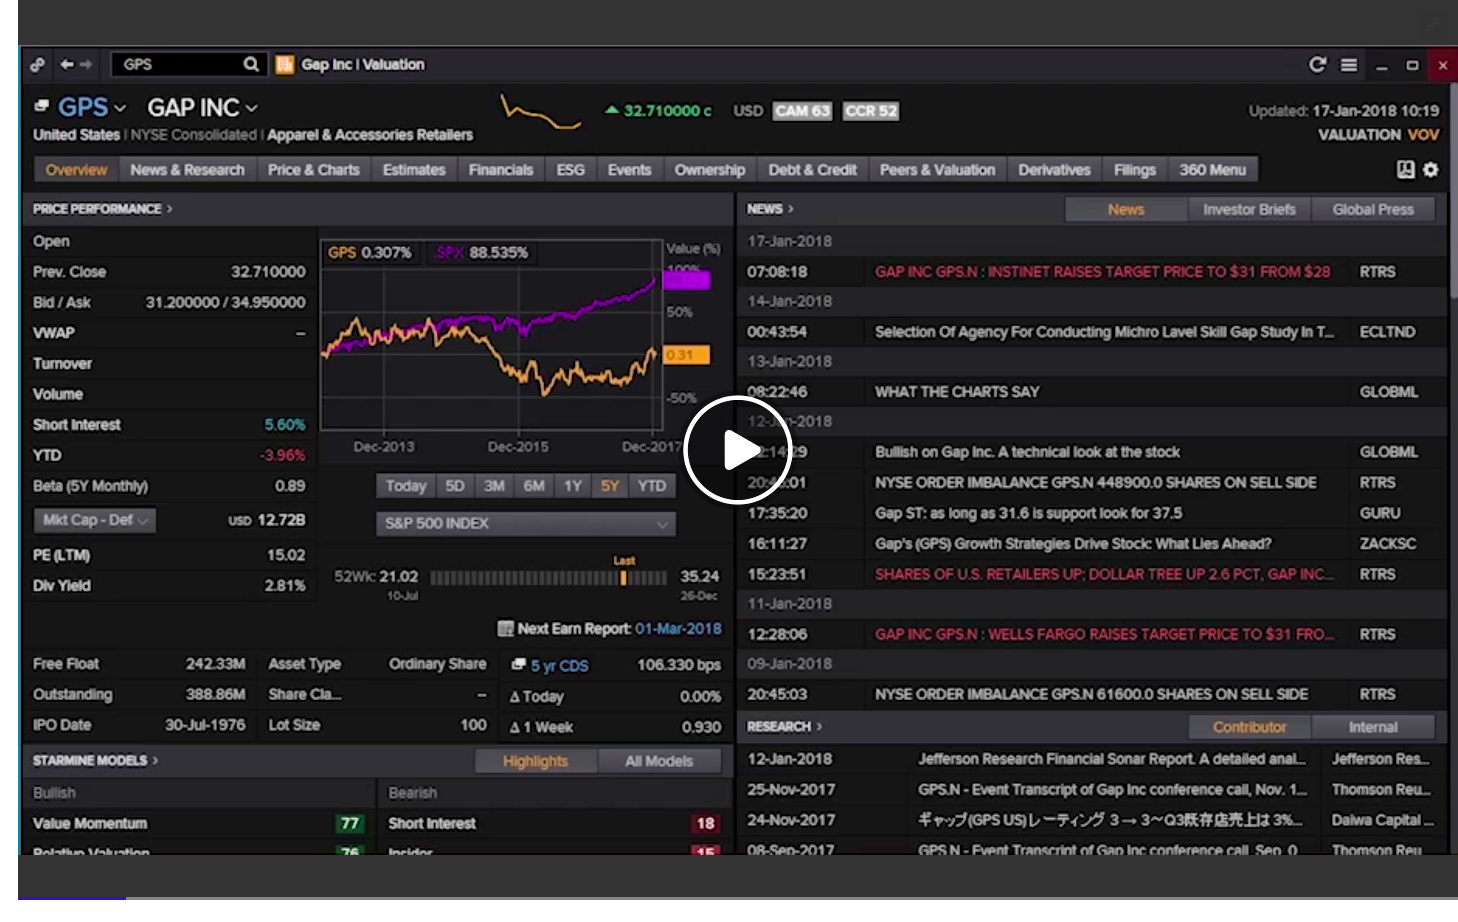
A quick tour of the Company Overview page including coverage. Total Running Time 4:49
Eikon provides the most complete view of Estimates data, incorporating the industry leading depth and breadth of IBES Estimates Content. Watch this video to learn how to keep up to date with current Analyst Estimates, Target Prices and Recommendations.
Thomson Reuters Ownership & Institutional Profiles content allows you to track the investment activity of key institutional investors and contact their key decision makers. Insider activity is also covered. Discover some of the key ways which this market leading content set is exposed in Eikon and its add-in for Microsoft Office.
'Eikon - Microsoft Office' is a suite of add-ins for Microsoft applications. It is primarily focused on Excel, and includes some presentation tools for Word and Powerpoint. Follow this eLearning for an introduction to data retrieval in Excel, and to discover some other features and tools. Continue your study of the add-in using the 'Core Excel Skills' course or dive straight into the task and functionality based tutorials.
This module includes the following topics:
- About Datastream Charting (02:12)
- Working with Datastream Chart Studio (DSCHART) (02:25)
- Exploring Chart Studio (02:19)
- Apply Datatypes, Currencies and Functions (03:08)
- Changing Chart Settings and Line Styles (02:00)
Environmental, social and governance, or so called E-S-G issues, are becoming more important to investors looking to identify long-term opportunities and risks for companies. Eikon covers the full range of ESG data: standardized metrics as well as real-time signals and insights.
Learn how to monitor instruments within a Portfolio or List, and automate repetitive tasks. To save time and increase productivity you can choose from a library of preset routines or build your own with customized navigation
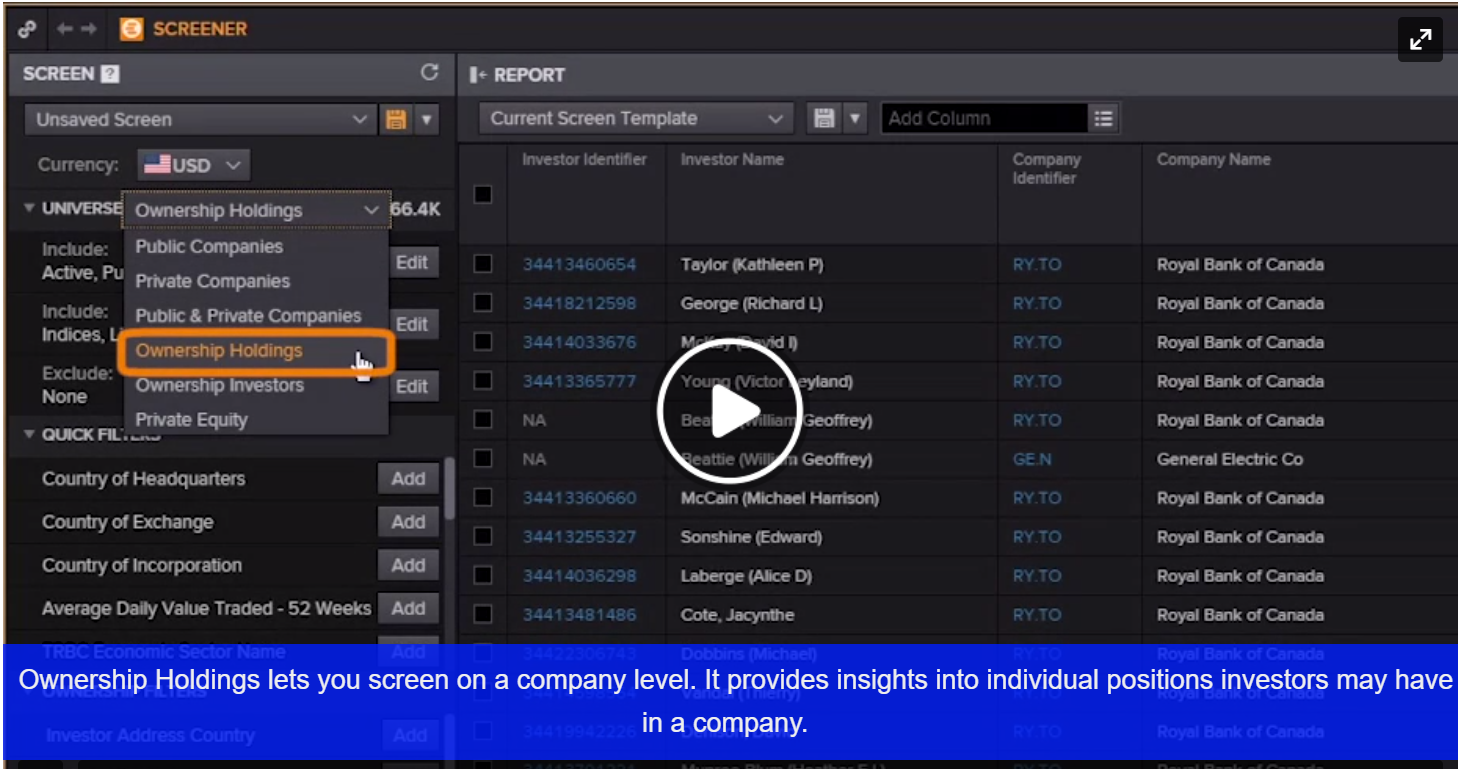
Screener now lets you screen on ownership data and identify holdings positions from investors in public companies.
Learn how to perform total return calculations and analyze P&L for multiple instruments with the new Total Return app (short code TRTR), by taking full control of calculation settings. Also discover what the MS Office add-in has to offer.
Eikon’s Interactive Income Statement (IIS) allows you to conduct basic financial modeling and helps you better understand the dynamics of a company’s Income Statement. The model bridges the gap between past results and estimates of future performance. Take a look at this video to learn more.
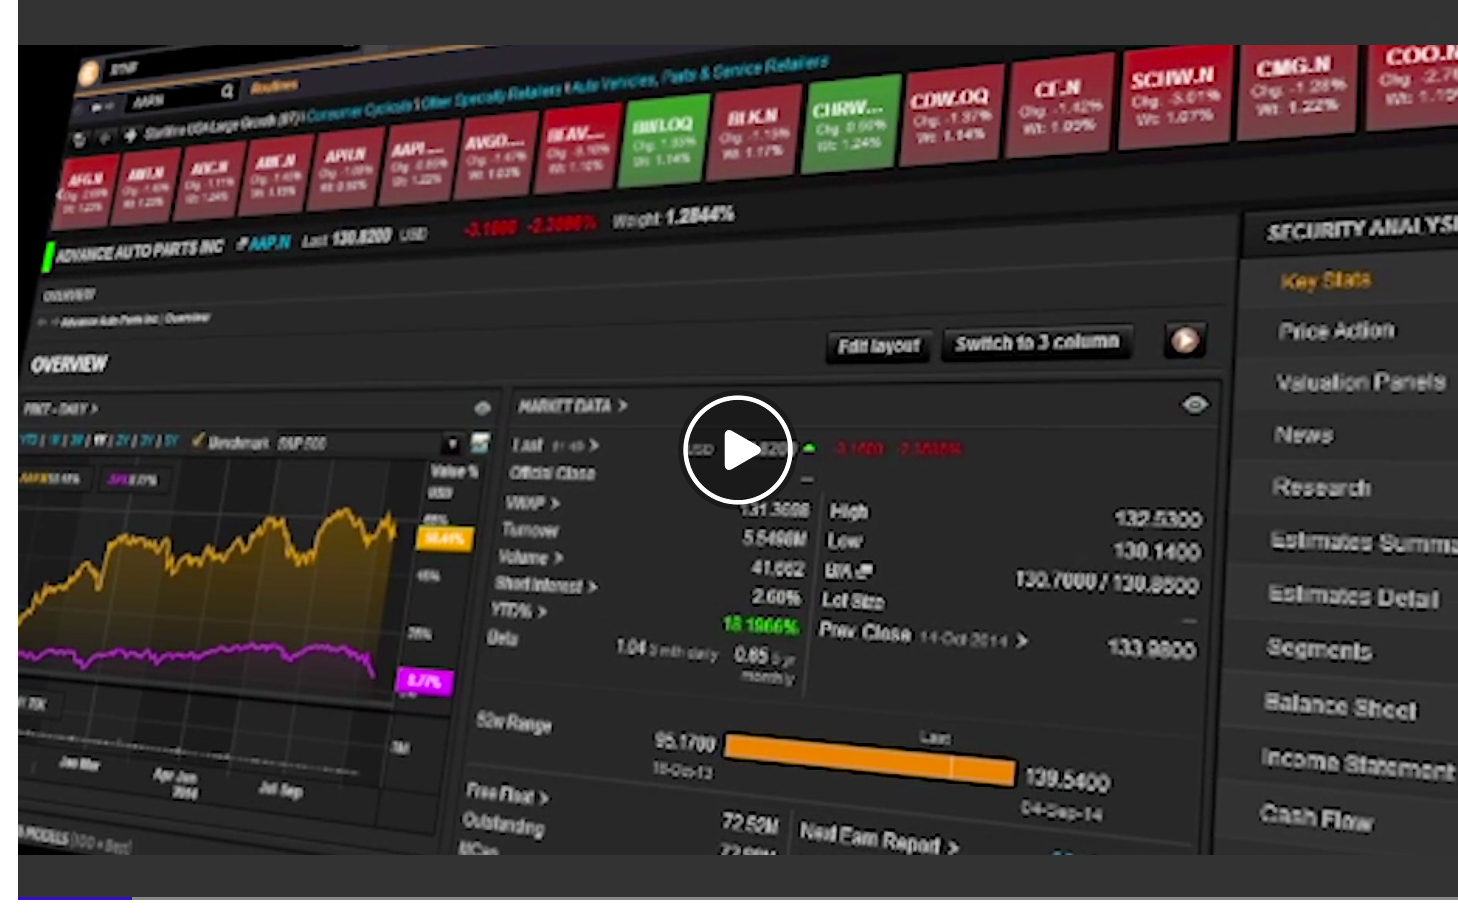
The Key Stats app is a collection of key statistics of a company. It provides a current snapshot and assists you with bottom-up analysis, stock valuation and stock comparison for up to 4 stocks
The Technical Analysis Chart App allows you to apply various analyses to the instruments you monitor with intuitive collaboration tools. Discover how to access and use this powerful charting application.
The Signal App (SIGNAL) allows you to monitor in real-time a universe of securities against a set of technical criteria, and be alerted when any of the conditions are met. Select from a list of over 150 predefined signals or create your own using the Custom Signal Editor. Watch this short video to find out how.
Available in Eikon - Version 3.3 and later, the Relative Rotation Graph provides a visual presentation of how a group of securities (or sectors) are performing relative to a benchmark. If you are a trader or investment analyst then make the RRG a key piece in your investment research puzzle.

Power Tip: Discover what Investment Managers are investing in right now and how their investment strategies have changed over time
Gain a competitive advantage with real-time short interest data that is 6x more accurate than the competition and let’s you accurately understand bearish bets, price action, market conviction and benchmark financing rates.
Getting Started: An Introduction to Portfolio Analytics (PORT)
MSCI Risk Metrics Solutions are now available within the Portfolio Analytics suite in Eikon. You can quickly identify potential problem areas allowing for better Portfolio Risk management. The integration of MSCI Risk Metrics into Eikon gives you the ability to stress test while performing other tasks, such as performance monitoring. It helps increase the efficiency of your investment process.Watch this video to learn more.
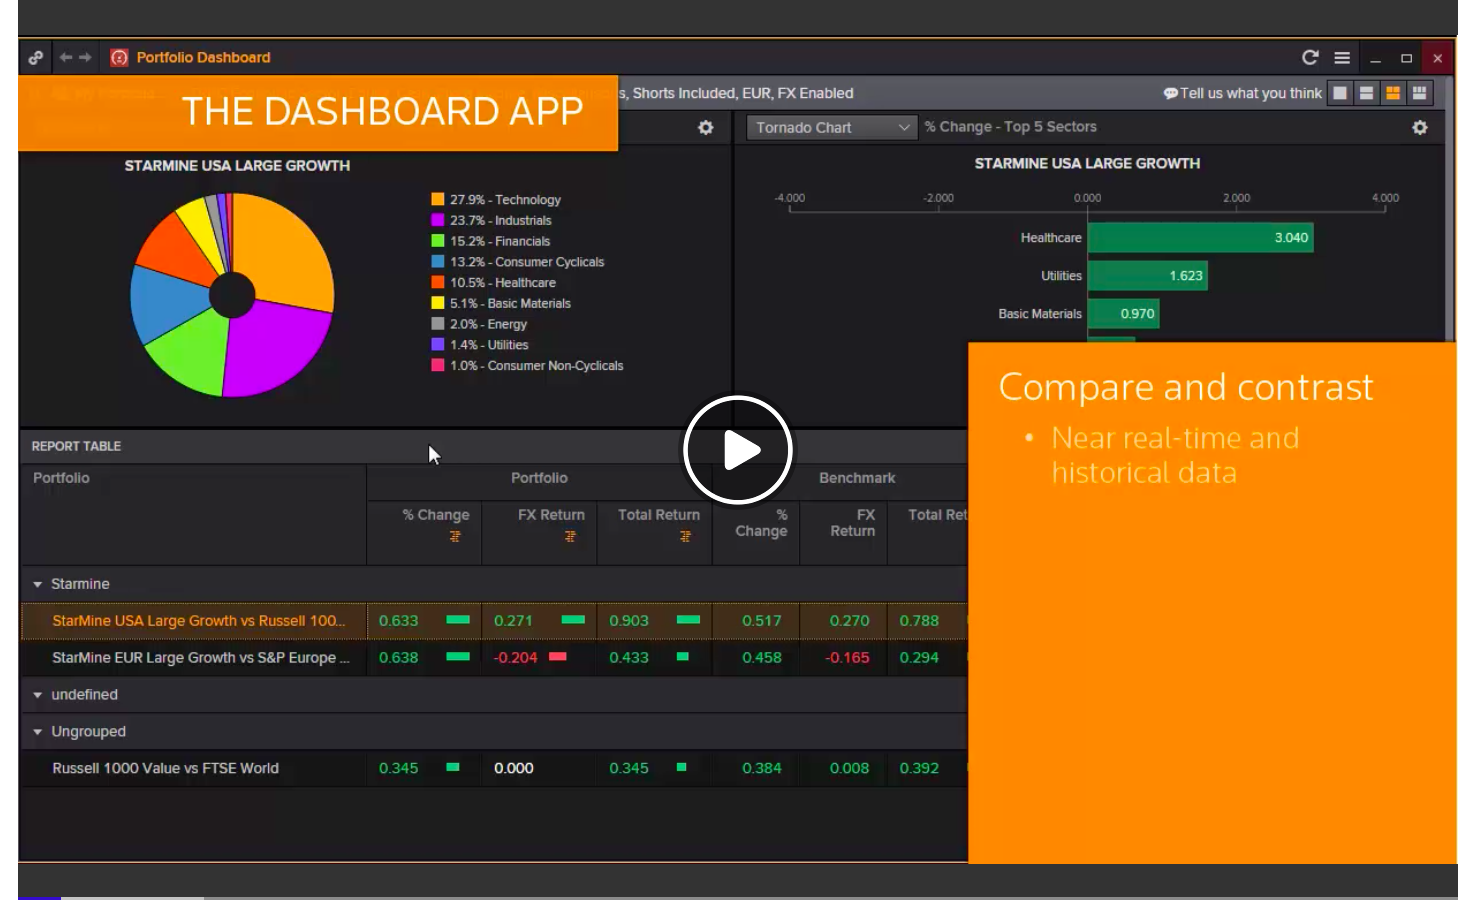
The Dashboard App (DASH) allows you to quickly compare and contrast near real time and historical performance of up to 25 Portfolio and Benchmark pairs. The Pairings can be easily tailored to suit your investment processes and layouts can be saved and recalled at any point in time. Use Dashboard to monitor intraday performance at the highest level throughout the day. Understand how to effectively use the Dashboard App to help you maintain your with day to day investment strategy.
Watch this video to learn more about the Intraday App (INTRA) and how to use to successfully monitor your portfolio performance on an intraday basis.
This module includes the following topics:
- Creating a New Portfolio or List (05:01)
- Entering Instruments to your Portfolio (04:15)
- Importing a File from Excel (02:56)
- Editing your Portfolio (02:21)
- Creating Carve Out Portfolios (01:19)
- Creating Composite Portfolios and Custom Benchmarks (03:13)
- Sharing Portfolios and Lists (01:25)
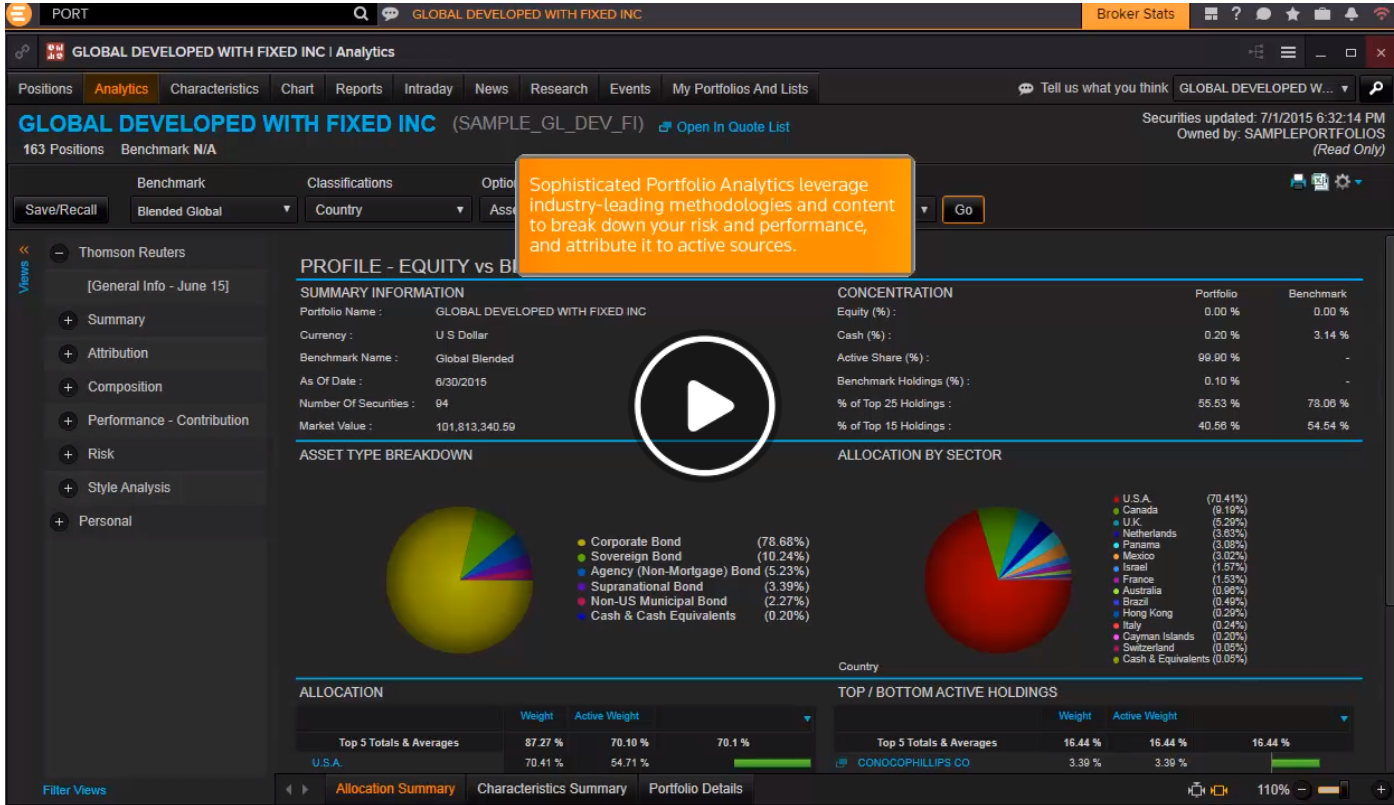
Follow this course to understand how to successfully perform in depth Portfolio Analysis within Eikon. Learn how to analyze Portfolio Composition,Contribution, Attribution and Risk
Discover the benefits and value-add functionality of Report Writer. Learn how to customize your reports, create favorites, algorithms, as well as use conditional formatting and easily export your reports to Excel.
Learn how to use Batch Reporting within Eikon Portfolio Analytics (PORT)and produce scheduled reports which you can share with your colleagues and clients
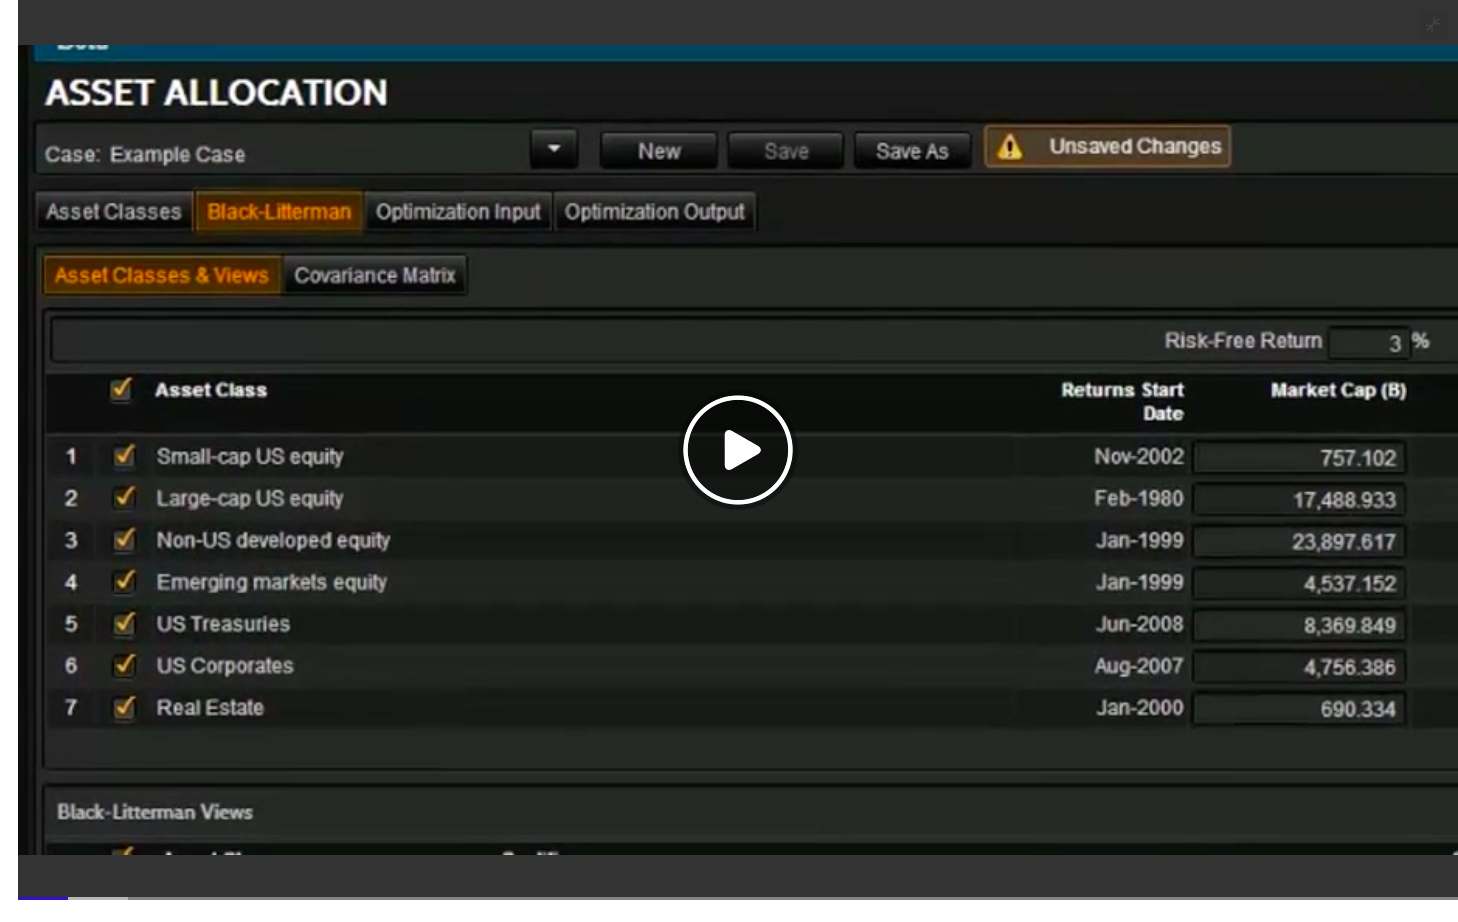
Thomson Reuters Asset Allocation is a returns-based optimizer for performing high level asset class analysis to aid you in reaching practical asset allocation solutions quickly and efficiently.
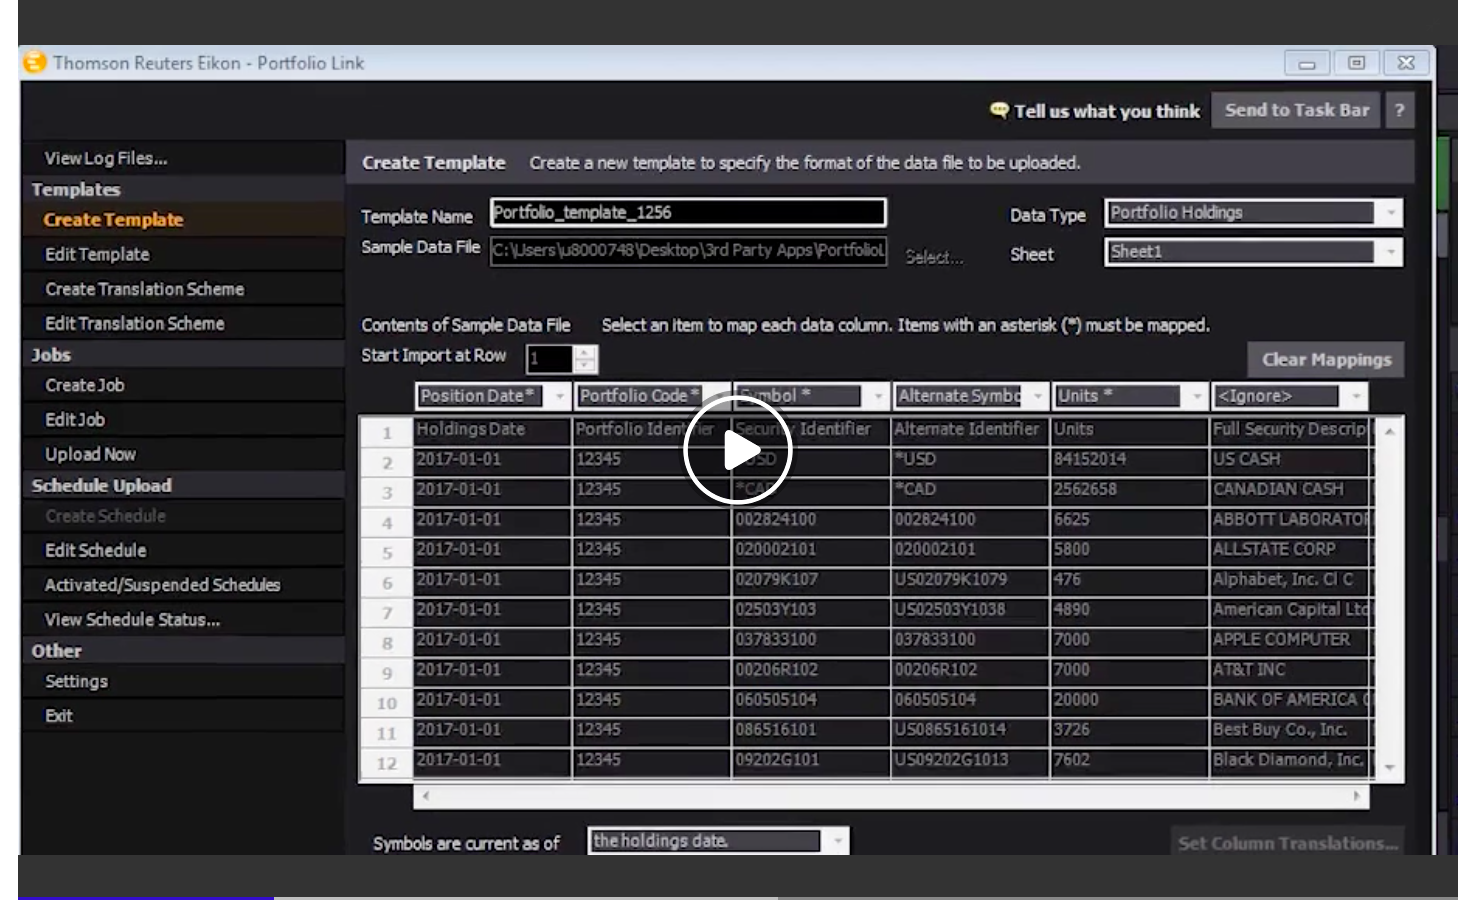
PortfolioLink is an add-on functionality for Eikon or as a stand-alone product. Targeted at smaller scale investment firms, it lets users perform daily uploads of portfolios, lists, transactions, and related custom characteristics. Watch this set of videos to learn more.
Watch this short video to see how to easily access Research on your Eikon mobile device.
In addition to the wealth of native apps and tools, Eikon provides access to a global library of specialist 3rd party apps. These include advanced charting, pricing calculators, unique datasets and cutting edge analytics. Watch this short video to learn more.
This module introduces you to the Google Chrome extension that lets you access Eikon anywhere.
Document: Eikon Mobile Factsheet
This module includes the following topics:
- Accessing and Sharing Workspaces (1.18)
- Customizing Apps With the Toolbar and Right-Click Options (1:35)
- Sharing Apps in Messenger (00:50)
Quick Reference Card - Eikon Proprietary Research and Data

The StarMine Combined Alpha Model (CAM) combines all available StarMine alpha models in an optimal, static, linear combination.

StarMine’s Insider Filings Model is a US only model. It uses insider holdings and insider trades to determine the overall sentiment of insiders towards their company. Underlying the proprietary algorithm of this thoroughly backtested model is the basic intuition that insider purchasing reflects bullish sentiment while insider selling reflects bearish sentiment.
Tim Gaumer , Director of Fundamental Research, discusses how to use StaMine's advanced quantitative analytics inline with the Eikon Screeener tool to generatae your next great investement idea.
The StarMine Combined Credit Risk model (CRM) is a powerful tool that enables the evaluation of corporate credit risk. It intelligently combines the power of StarMine’s three credit risk models. Take a look at this video to understand the workings of the model and how it aids the identification of companies worth investing in.
Price Momentum Models (PMO) rank stocks based on recent historical price performance. The models claim that information contained in past price changes can be used to predict future price changes. Watch this video to understand the workings of the StarMine Price Performance model and how it can help you generate successful investment ideas.
Learn how to access the Intrinsic Valuation Model (IV) within Eikon and analyze future projections for growth for the companies you are interested in. Compare proprietary model projections versus market-implied, as well as your own personally customized values. Total Running Time 4:55

Eikon gives you access to number of valuable StarMine Models. The Relative Valuation Model (RV) enables you easily identify investment opportunities and the stocks that are better value and deliver better yields relative to their peers. Watch this video to learn more about the benefits to you.

The StarMine Earnings Quality Model (EQ) is closely tied to fundamentals and inputs in the financial statements. It enables you to measures the degree to which past earnings are reliable and are likely to persist. Watch this video to learn how to use the Earnings Quality Model. Total Running Time
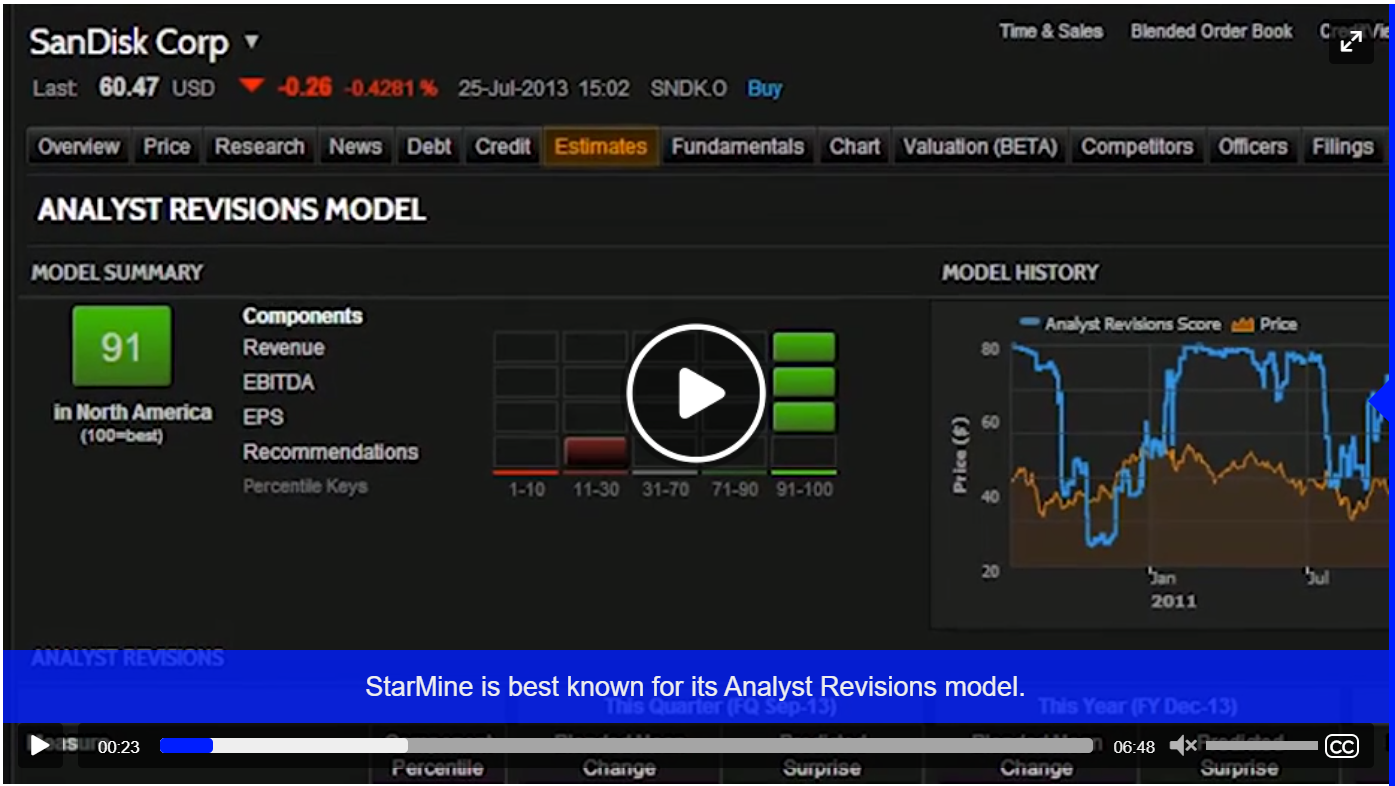
The Analyst Revisions model (ARM) is a quantitative model incorporating revisions to the Estimates Mean values while accounting for current predicted surprises. It enables you to track changes in analyst sentiment and is highly predictive of relative price movement. In this On Demand video, learn the key highlights of the model and how to use it. Total Running Time 4:51

In this video we will present you a unique screen (SCREENER) that can help you to find promising short selling ideas.

Tim Gaumer, Director of Fundamental Research provides insight into the value of the StarMine SmartEstimate and Predictive Surprise. Watch this video to learn more about how to access this information and how it can effectively be used.
Tim Gaumer, Director of Fundamental Research provides an overview of how to effectively use the StarMine Value Momentum Model (ValMo) to effectively identify investment opportunities. The combination of valuation and momentum signals aids stock selection.

Watch this video to see Tim Gaumer, Director of Fundamental Research, providing an in depth overview of how to effectively monitor companies and identify prospective investment opportunities with the StarMine Price Momentum Model in Eikon.

Understand in more detail how to monitor portfolio risk with Eikon. David Suarez, Senior Quantitative Analyst, provides an in-depth overview of the Global Risk Model and how it can be used to effectively track portfolio risk.
Watch this video to learn from expert Sason Tarosean how to effectively work with Attribution Analysis in Eikon.
Sri Raman, Senior Research Analyst at Thomson Reuters talks about how Eikon and Starmine models can be effectively used to examine credit risk
Meet Sri Raman, Senior Research Analyst at Thomson Reuters. Find out how he uses the Screener and the StarMine Intrinsic Valuation model in Eikon to identify undervalued stocks in an overvalued sector.
How to use Cross Currency Swap Matrix in Swap Pricer.
Meet Greg Harrison, Senior Research Analyst at Thomson Reuters. Find out how he uses the segment function in Eikon to analyse companies. Discover what business segments are becoming more important to a company and how profitable they are. Find out what geographic regions and currencies a company is exposed to and get an impression of how this might impact future earnings.
This video gives you a quick overview of essentials tools and content in Eikon - version 4 for the Fixed Income Market. Find out about our unrivalled Rates, Tradeweb and Credit screens, the newly integrated IFR Markets and Bond Holders services, more intuitive navigation and much more.
Instantly navigate to anywhere using the new Eikon menu and the Search box. They are your gateway into a vast array of information and applications. Find out here how to search by name, coupon, maturity, partial code, ISIN and other market standard codes, as well as questions. If you would like to use more complex search criteria also learn more about the Advanced Search (GOVSRCH).
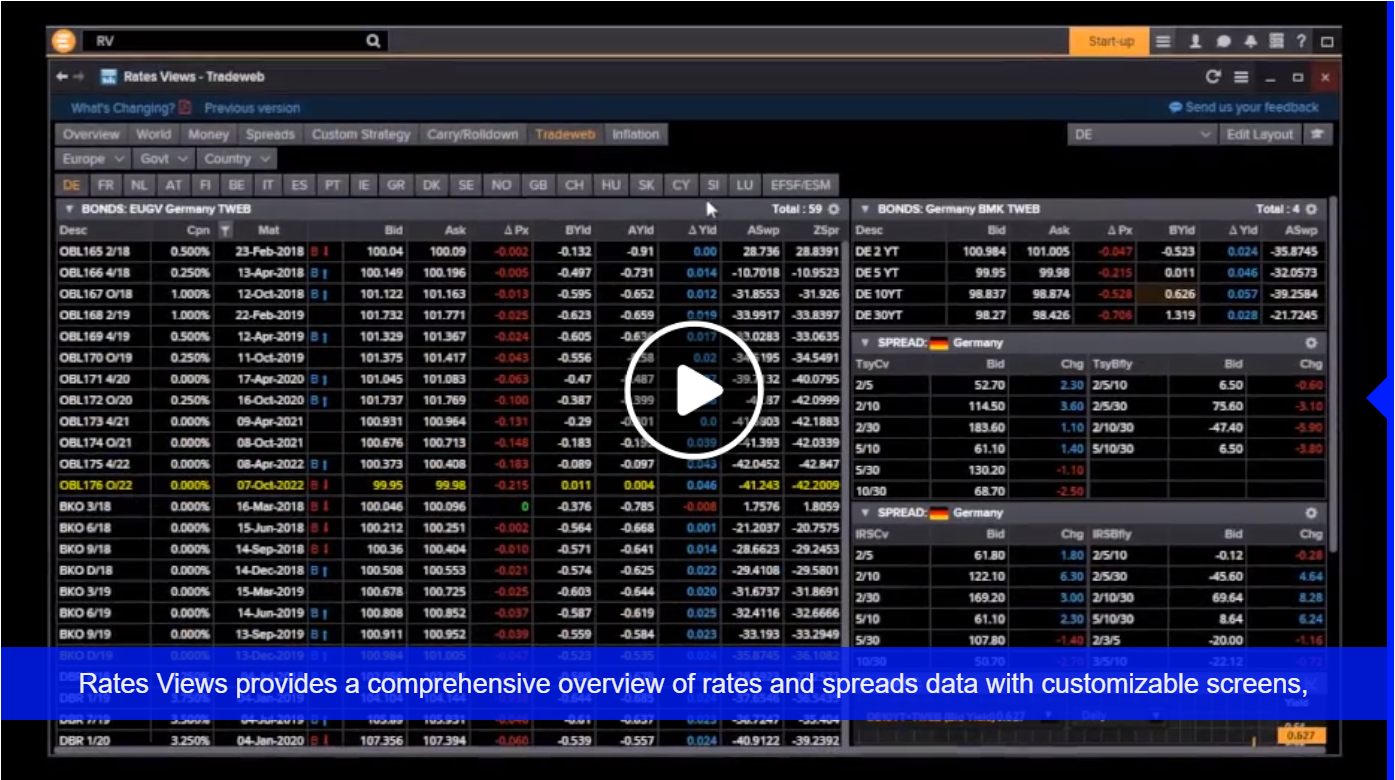
Rates Views (RV) provides comprehensive rates prices and related spread data for cash, derivative and future products. A suite of calculated spreads provides visibility on trade flow across G40+ markets and you can spot investment opportunities with intuitive charting. Tradeweb is fully integrated along with pop out screens to fully customize the Rates Views experience. NEW: We have now integrated new visualizers in the Carry&RollDown tab. Watch this video now to find out more!
This video focuses on the key benefits of upgrading to Eikon from Datastream Advance
{"policylink":"/content/mytr/en/policies/training-portal/riskmanagementsolutionstraininghome/worldcheckonetraining.html","linktext":"Learn More","link":"/content/mytr/en/policies/training-portal/riskmanagementsolutionstraininghome/worldcheckonetraining.html","UserRole":[]},{"policylink":"/content/mytr/en/policies/training-portal/riskmanagementsolutionstraininghome/enterpriseriskmanagertraining.html","linktext":"Learn More","link":"/content/mytr/en/policies/training-portal/riskmanagementsolutionstraininghome/enterpriseriskmanagertraining.html","UserRole":[]},{"policylink":"/content/mytr/en/policies/training-portal/riskmanagementsolutionstraininghome/Worldcheckonenew.html","linktext":"Learn More","link":"/content/mytr/en/policies/training-portal/riskmanagementsolutionstraininghome/Worldcheckonenew.html","UserRole":[]},{"policylink":"/content/mytr/en/policies/training-portal/riskmanagementsolutionstraininghome/connectedrisktraining.html","linktext":"Learn More","link":"/content/mytr/en/policies/training-portal/riskmanagementsolutionstraininghome/connectedrisktraining.html","UserRole":[]},{"policylink":"/content/mytr/en/policies/training-portal/riskmanagementsolutionstraininghome/regulatorychangemanagementtraining.html","linktext":"Learn More","link":"/content/mytr/en/policies/training-portal/riskmanagementsolutionstraininghome/regulatorychangemanagementtraining.html","UserRole":[]},{"policylink":"/content/mytr/en/policies/training-portal/riskmanagementsolutionstraininghome/auditmanager.html","linktext":"Learn More","link":"/content/mytr/en/policies/training-portal/riskmanagementsolutionstraininghome/auditmanager.html","UserRole":[]},{"policylink":"/content/mytr/en/policies/training-portal/riskmanagementsolutionstraininghome/screenresolutionservice.html","linktext":"Learn More","link":"/content/mytr/en/policies/training-portal/riskmanagementsolutionstraininghome/screenresolutionservice.html","UserRole":[]},{"policylink":"/content/mytr/en/policies/training-portal/riskmanagementsolutionstraininghome/screeningdeployed.html","linktext":"Learn More","link":"/content/mytr/en/policies/training-portal/riskmanagementsolutionstraininghome/screeningdeployed.html","UserRole":[]},{"policylink":"/content/mytr/en/policies/training-portal/riskmanagementsolutionstraininghome/enhancedduediligencereports.html","linktext":"Learn More","link":"/content/mytr/en/policies/training-portal/riskmanagementsolutionstraininghome/enhancedduediligencereports.html","UserRole":[]},{"policylink":"/content/mytr/en/policies/training-portal/riskmanagementsolutionstraininghome/thomsonreuterskycasaservice.html","linktext":"Learn More","link":"/content/mytr/en/policies/training-portal/riskmanagementsolutionstraininghome/thomsonreuterskycasaservice.html","UserRole":[]},{"policylink":"/content/mytr/en/policies/training-portal/riskmanagementsolutionstraininghome/clientonboarding.html","linktext":"Learn More","link":"/content/mytr/en/policies/training-portal/riskmanagementsolutionstraininghome/clientonboarding.html","UserRole":[]}
[]
[]